


In this article, the authors propose a method to integrate the OWASP ZAP DAST tool with Jenkins to publish reports on the vulnerabilities found in a Web application ‘IIITB feedback’ and corresponding solutions. The source code of the project is available at https://github.com/RahulSapparapu/Iiitbfeedback/. The Web application accepts student ratings about a professor and saves each response in an SQL database. The authors use the open source tool OWASP ZAP to integrate with Jenkins for easier manual or automatic security testing, which can be helpful for both beginners and professional Web application developers.
Security is the main concern in the case of Web applications. Testing a product after deployment is a hard task. DevSecOps is a process of integrating security measures into the DevOps process. The Software Development Life Cycle (SDLC) is introduced in DevSecOps to make applications very secure by using a variety of tools for different security concerns. Dynamic Application Security Testing or DAST is a security measure where Web applications are tested dynamically for vulnerabilities while still in production. This type of testing is also called ‘black box testing’ as it does not consider the internal infrastructure of applications but instead looks at an attacker’s perspective. It is helpful to weed out vulnerabilities like SQL injection, cross-site scripting and even with some runtime problems like server issues and authentications. The DAST tool we have used for our experiment is called OWASP ZAP, which is one of the existing popular open source tools.
The system requirements are as follows.
- OS version: Kali Linux (with pre-installed security tools including OWASP ZAP)
- RAM allocation: Minimum of 4GB (in case of VM)
- Installed Jenkins and Java 8 version
Introduction to OWASP ZAP
Open Web Application Security Project Zaproxy (OWASP ZAP) is a popular DAST tool. It is used by most penetration testers for testing automation. We have used this tool for our Web application testing since it is easily integrated with Jenkins in the CI/CD pipeline with a plugin.
Integration with Jenkins
To automate the process of testing, we have integrated the OWASP ZAP tool with Jenkins using the tool’s plugin. The steps for the process of integration are given below.
1. Install the OWASP ZAP official plugin, HTML publisher plugin and custom tools plugin. In the Manage Jenkins option, select Manage Plugins. In the available section, select the OWASP ZAP official plugin, as shown in Figure 1.
2. In the Global Tool Configuration, click on the custom tools installations and complete the entries, as shown in Figure 2.
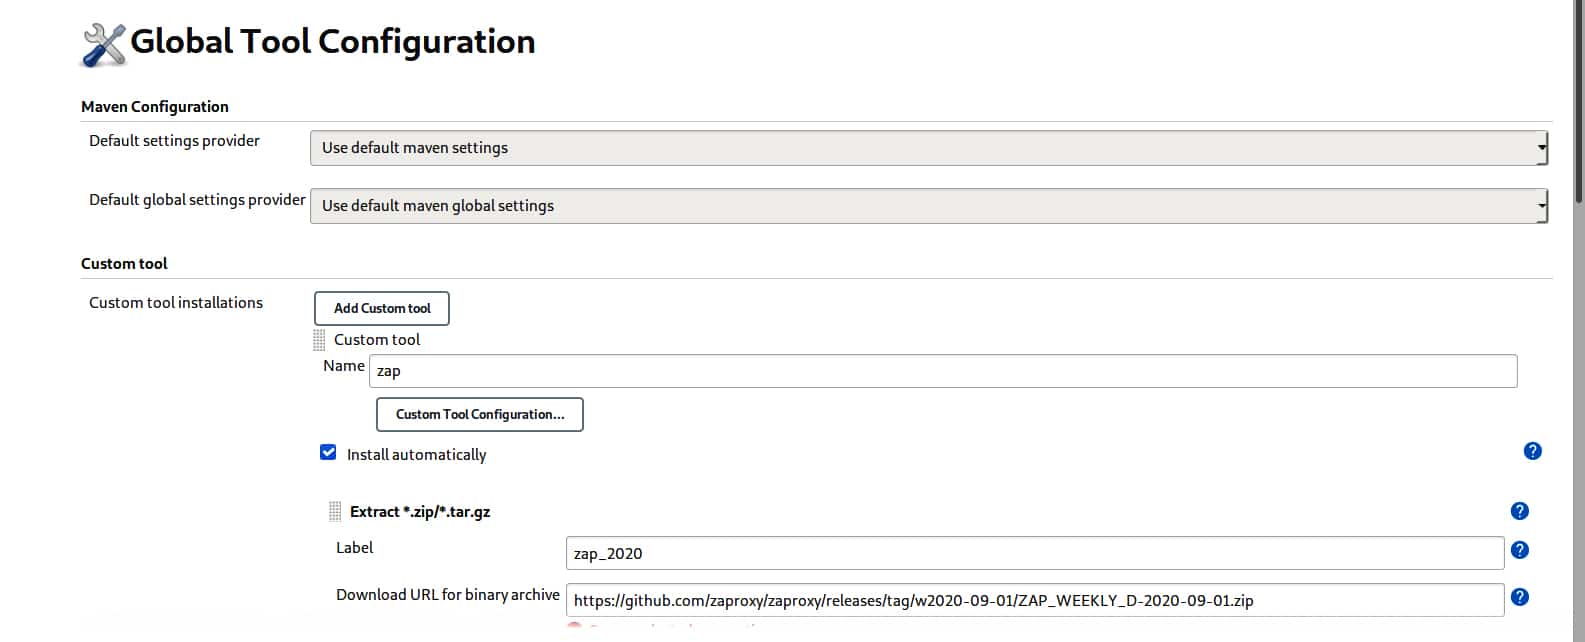
This allows us to use different tools in Jenkins like OWASP ZAP.
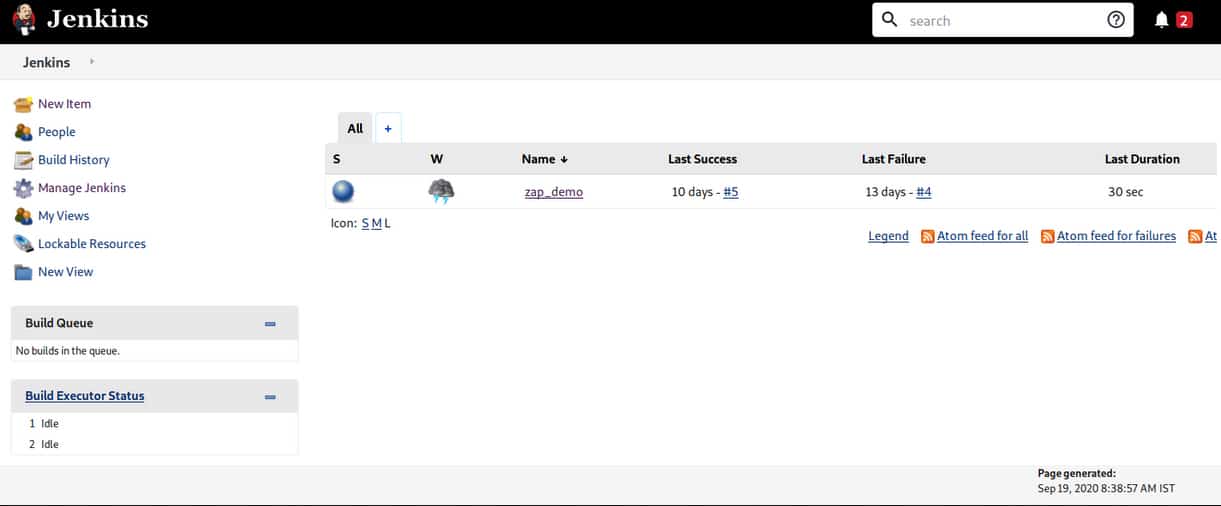
3. Create a new freestyle project called ZAP_demo using the New Item option shown in the dashboard (Figure 3) as soon as we start Jenkins.
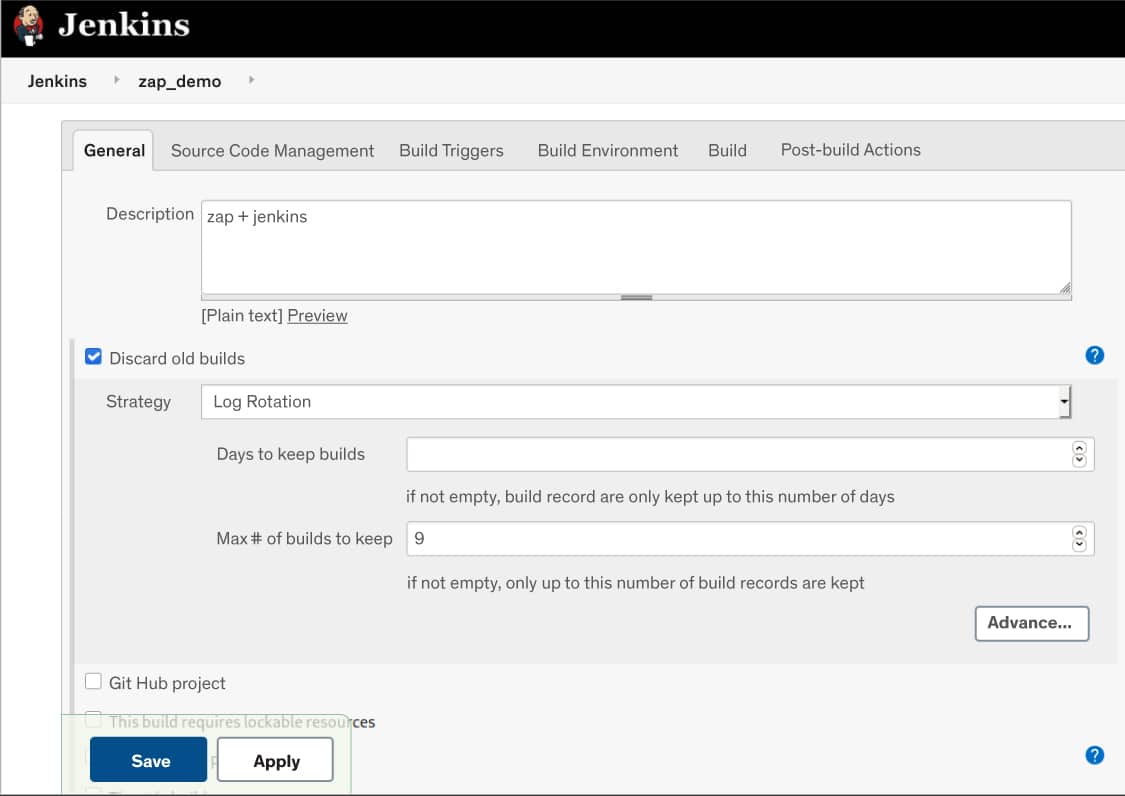
4. We can start the configuration of the new project by selecting the Configure option when we open the project. We will get a Configuration setup page, as shown in Figure 4. We specify how our new project should work when we build in this page.
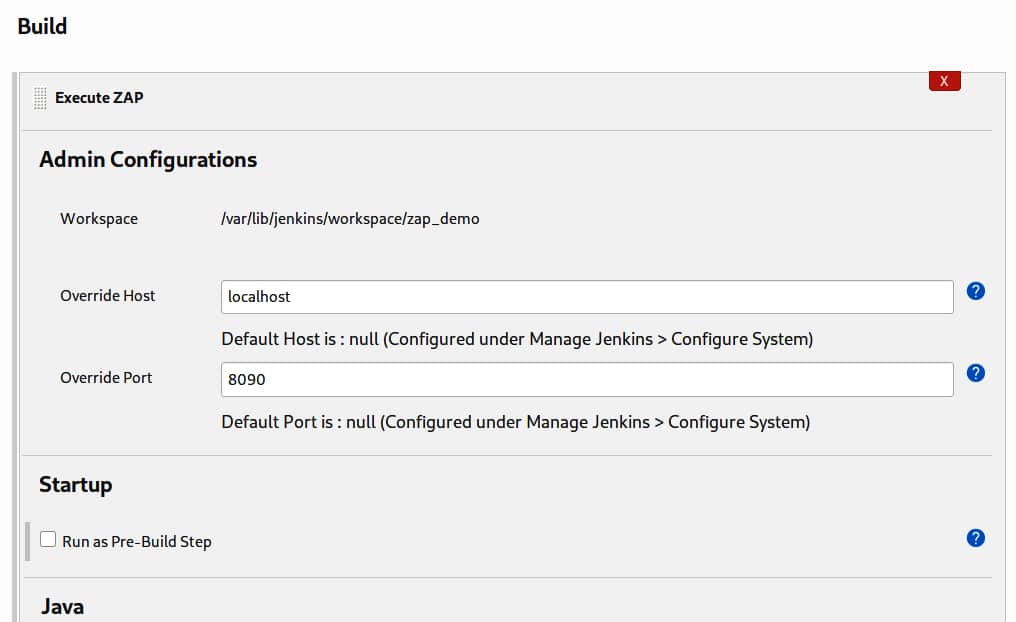
5. In the build stage, add a build step called Execute ZAP and fill in the Admin configuration as depicted in Figure 5.
6. If the OWASP ZAP tool is installed in the system, check the System Installed option in the installation method stage. If not, then check the custom tool installation option. If ZAP is already installed in the system, set the environment variable to the path of ZAP
(ZAPROXY_HOME) like in Figure 6.
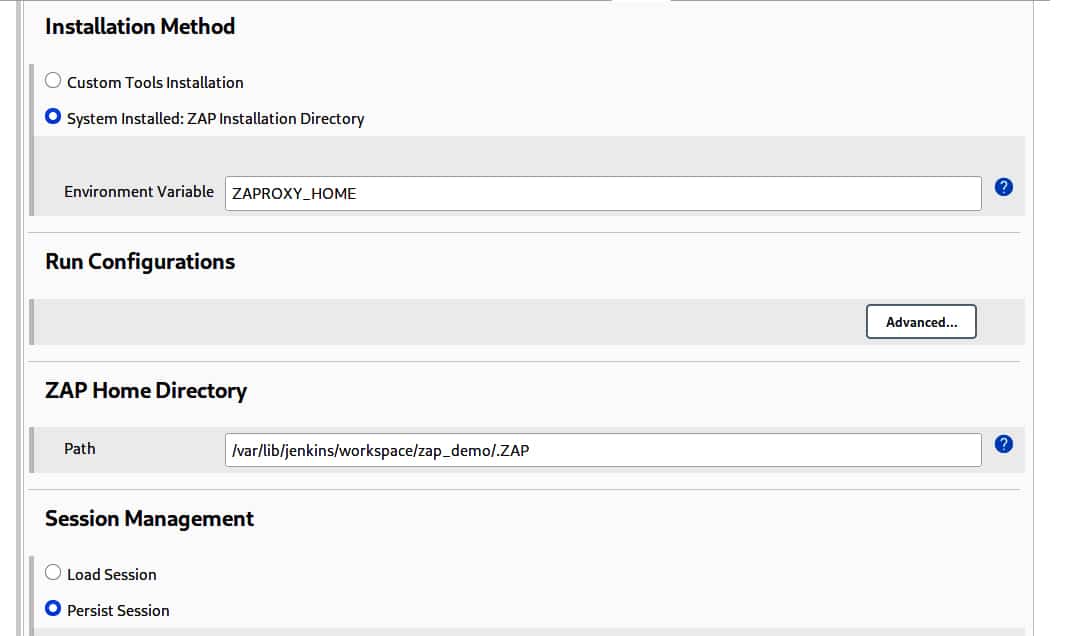
7. Next, in Session management, select Persist session and input any name for the session, as shown in Figure 6.
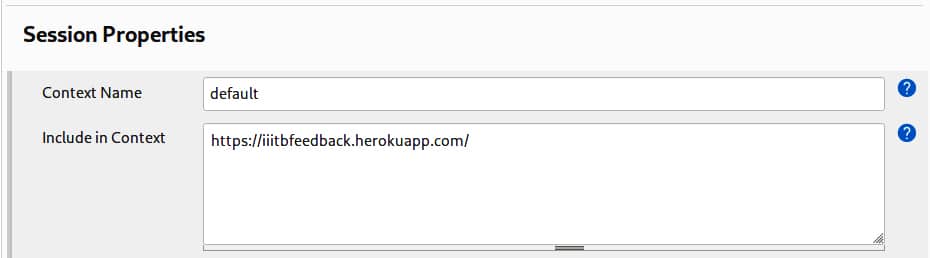
8. Under Session properties, set the context name to default and enter the URL where your Web application is running in the Include in Context option, as shown in Figure 7.
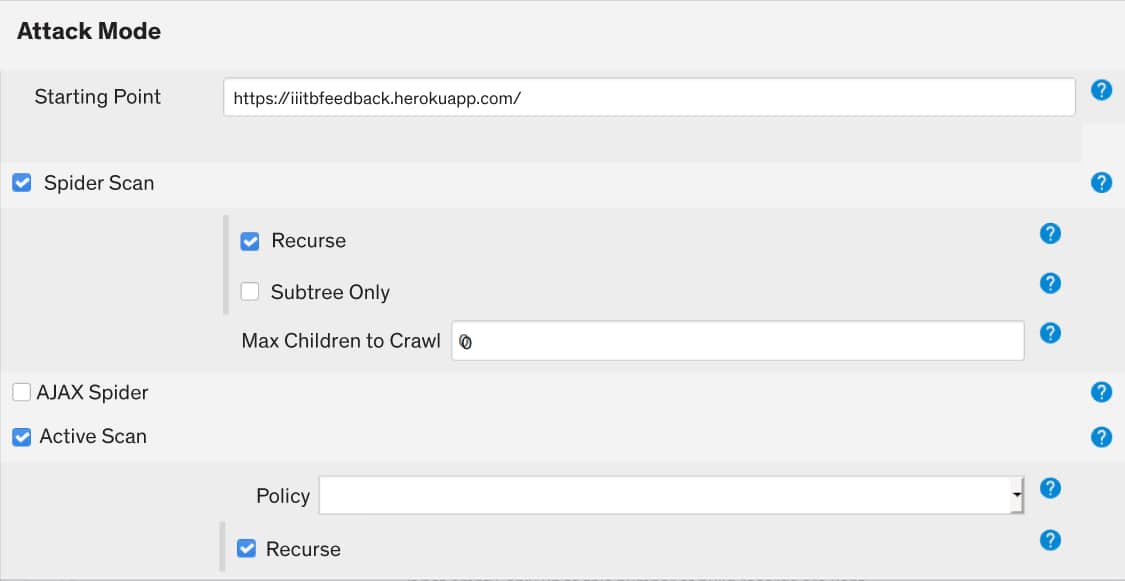
9. In the Attack mode stage, select the type of attack to be carried out on the mentioned Web application. This allows us to make a premeditated attack on our Web application to actively weed out the vulnerabilities from the viewpoint of the attacker. You can also choose the type of attack on the website to find different types of vulnerabilities. ZAP gives us two spiders to crawl a given Web application. These are the traditional spider and the Ajax spider.
The traditional spider is faster compared to the Ajax spider but not as effective for Ajax Web applications. The traditional spider explores the response HTML, while the Ajax spider invokes browsers and then follows the links that are given out. We can use either one of these or can use both in our penetration testing, as shown in Figure 8.
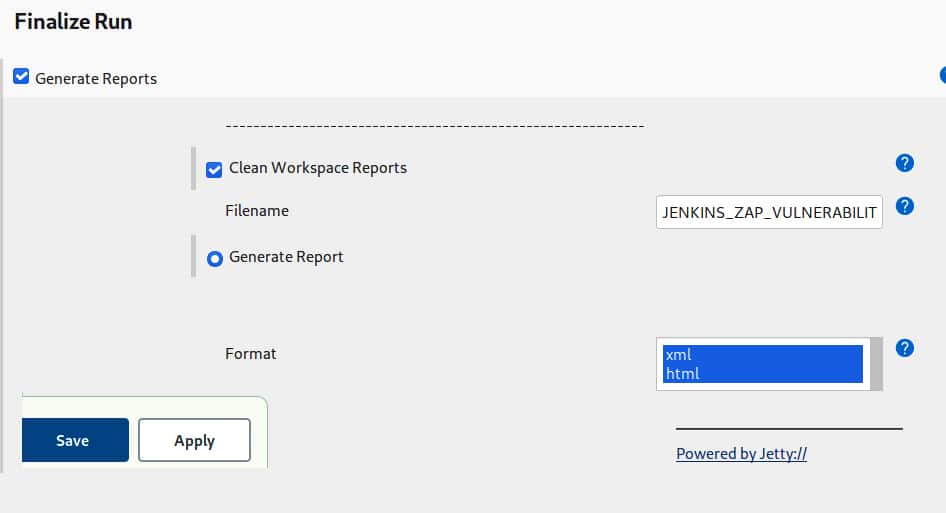
10. In the Finalize run section, select Generate Reports to get the results of the attack previously conducted, and select the type of reports you want to get. It has two options — XML or HTML type of reports or both can be published, as seen in Figure 9. Save the configurations.
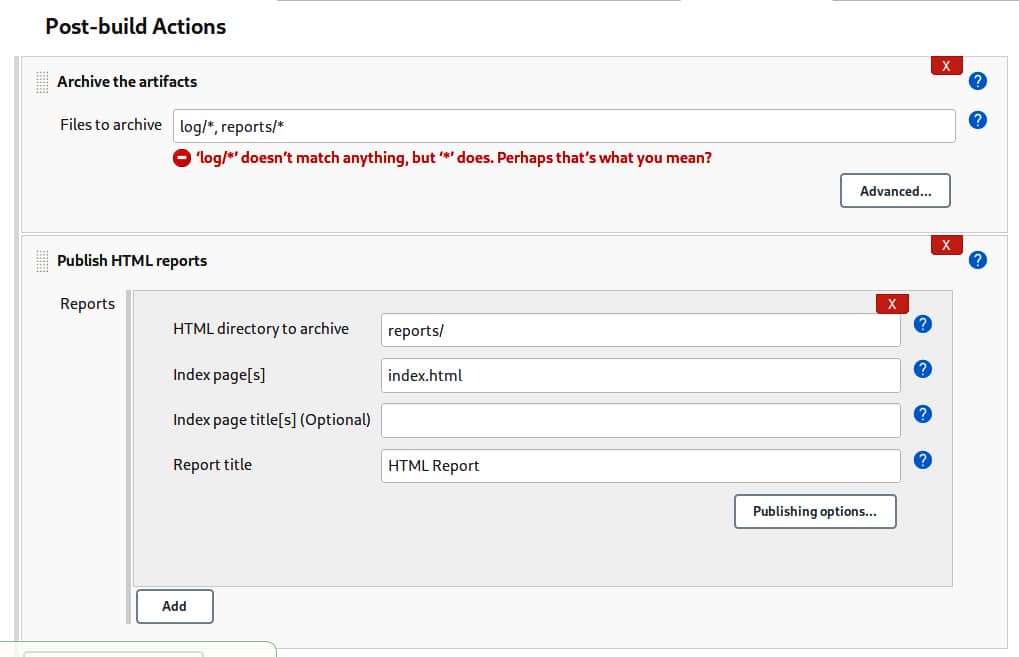
11. In the post-build step, select Archive the artifacts, publish the HTML reports option and fill in the details, as shown in Figure 10. Here, we can name the HTML reports as per our needs as well as the folder where it is being published.
The result
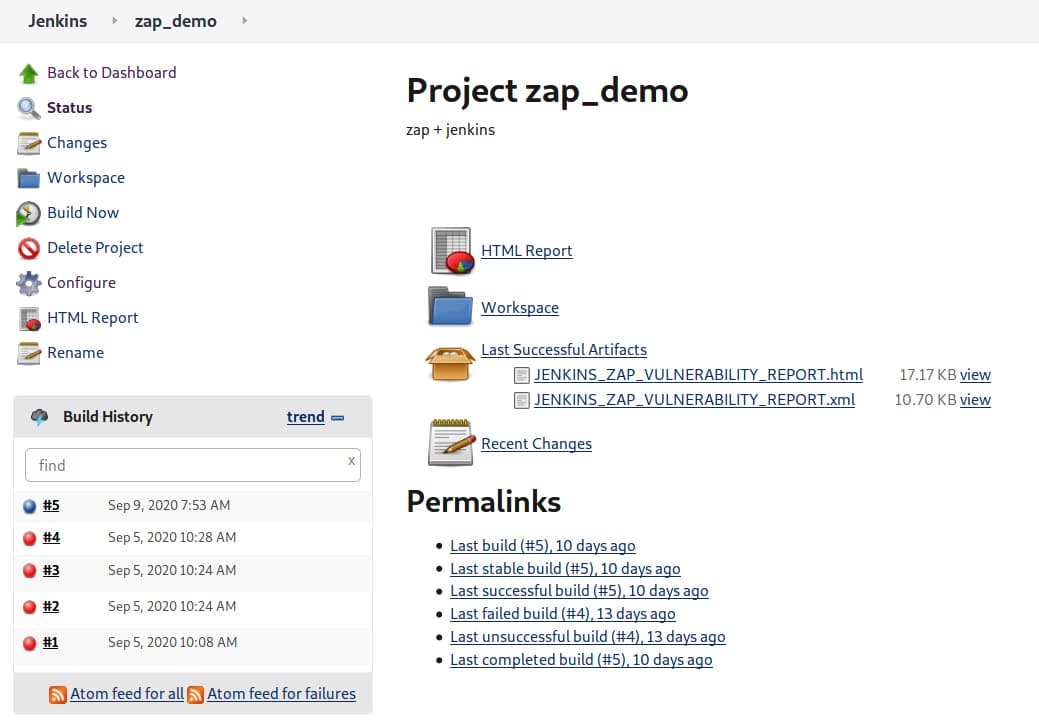
After building the project, we get the options to open the reports of our choice in the Stage view area. Reports can be accessed by selecting the links below the last successful artefact’s icon, which is shown in Figure 11.
From the generated report, we can find a detailed summary of the type of attacks done, the number of vulnerabilities found at various degrees of threat levels, and an explanation of the vulnerability along with the solutions for it. Figure 12 shows the ZAP scanning report for our Web application.
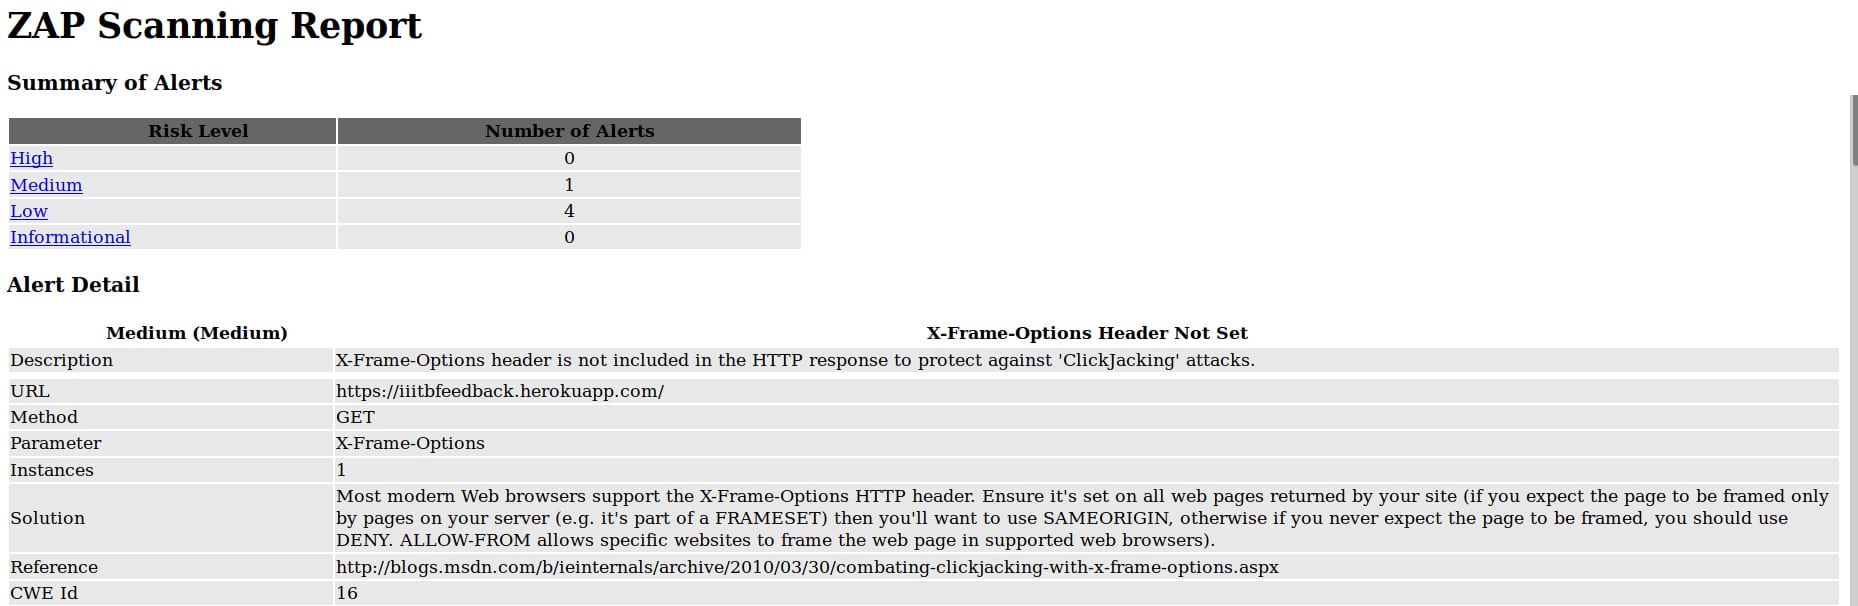
From the report, we can infer that the threat levels of the vulnerabilities are divided into four categories, namely, High, Medium, Low and Informational which are provided to us in the form of a table. For example, in the above case we found one medium level threat and four low level threats in our Web application.
The report also gives a detailed account of each type of vulnerability found. It provides a description of the vulnerability parameters as well as the solutions to resolve them as shown in Figure 13, where we have found a vulnerability called ‘X-frame option header is not present’. The method to resolve this vulnerability is given in the solution section. You can also use the link given in the Reference section to further read up on the resolution method.

The Open Web Application Security Project Zaproxy (OWASP ZAP) tool is used for Dynamic Application Security Testing of the Web application. From the result, we were able to identify threats and proposed solutions. This article may help you to identify threats at the production or development stage, and resolve the security issues early on instead of after the complete product development.


