


One of the important aspects of making an application successful is to deliver it with an effective and intuitive user interface. Many of the modern data-heavy apps face the challenge of building an effective user interface quickly, without taking complicated steps. Streamlit is a promising open source Python library, which enables developers to build attractive user interfaces in no time. This article introduces various components of Streamlit that will enable you to migrate your plain scripts into readily usable Web apps in a jiffy.
Data science projects adopt various approaches, including machine learning, to build the core model. However, when these models are delivered to the actual users, there is a pressing need to build an easy-to-use, intuitive user interface.
Many-a-time machine learning projects are built in environments such as Jupyter or as standalone Python scripts. But these scripts cannot be handed over to the end users as they are, and need a friendlier user interface. However, the machine learning teams may not be able to spend a lot of time on building this user interface. Rather, they are generally more interested in fine-tuning the core model and making it optimal. This is the exact pain point that Streamlit addresses.
Streamlit is a free and open source software library based on Python to build user interfaces. It enables developers to turn their data scripts into Web apps in minutes. As it is entirely written in Python, you don’t need to be a UI master to build these Web apps. It is really not an exaggeration that the user interfaces can be made in minutes with Streamlit.
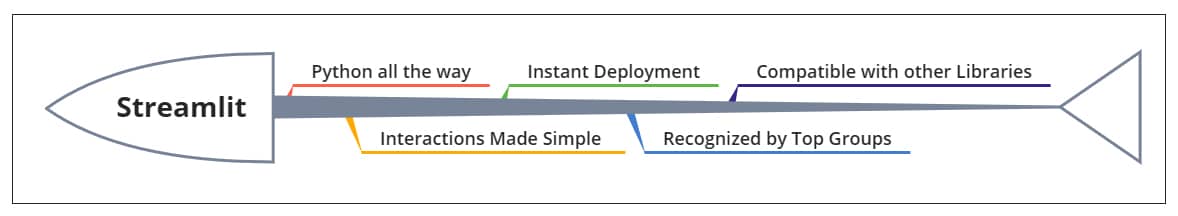
This article introduces you to the world of Streamlit and its powerful components are explained with the help of code snippets. Streamlit has the following advantages.
Python all the way: The Streamlit apps are built entirely with Python. You can build an app with just a few lines of code. When you update the code, you will see that the app gets updated with a simple notification.
Interactions made simple: Adding widgets into a Streamlit app is similar to declaring a variable. It doesn’t require building specific bindings, etc.
Instant deployment: The Streamlit sharing platform can be used to effortlessly share and collaborate.
Recognition: Streamlit is used by many leading data science groups, which proves its potential.
Compatible with other libraries: Streamlit is compatible with other libraries and frameworks such as Altair, Keras, PyTorch, OpenCV, LaTex and TensorFlow.
Getting started with Streamlit
You can get started with Streamlit by installing it using pip. You have to make sure that you have Python 3.6 – 3.8 installed in your system.
pip install streamlit
streamlit hello
After successful installation, Streamlit hello opens the sample app in your default browser.
Simple steps to build your first Streamlit app
You have to follow these simple steps to build your first Streamlit app:
- Open your favourite IDE and create a Python file (e.g.: osfy.py).
- As with any other Python libraries, import Streamlit:
import streamlit as st
Save your file and run the app with the following command in the terminal. You will notice that a new tab is created in your default browser with an empty app (http://localhost:8501). You can terminate this app any time by firing Ctrl + C in the terminal:
streamlit run osfy.py
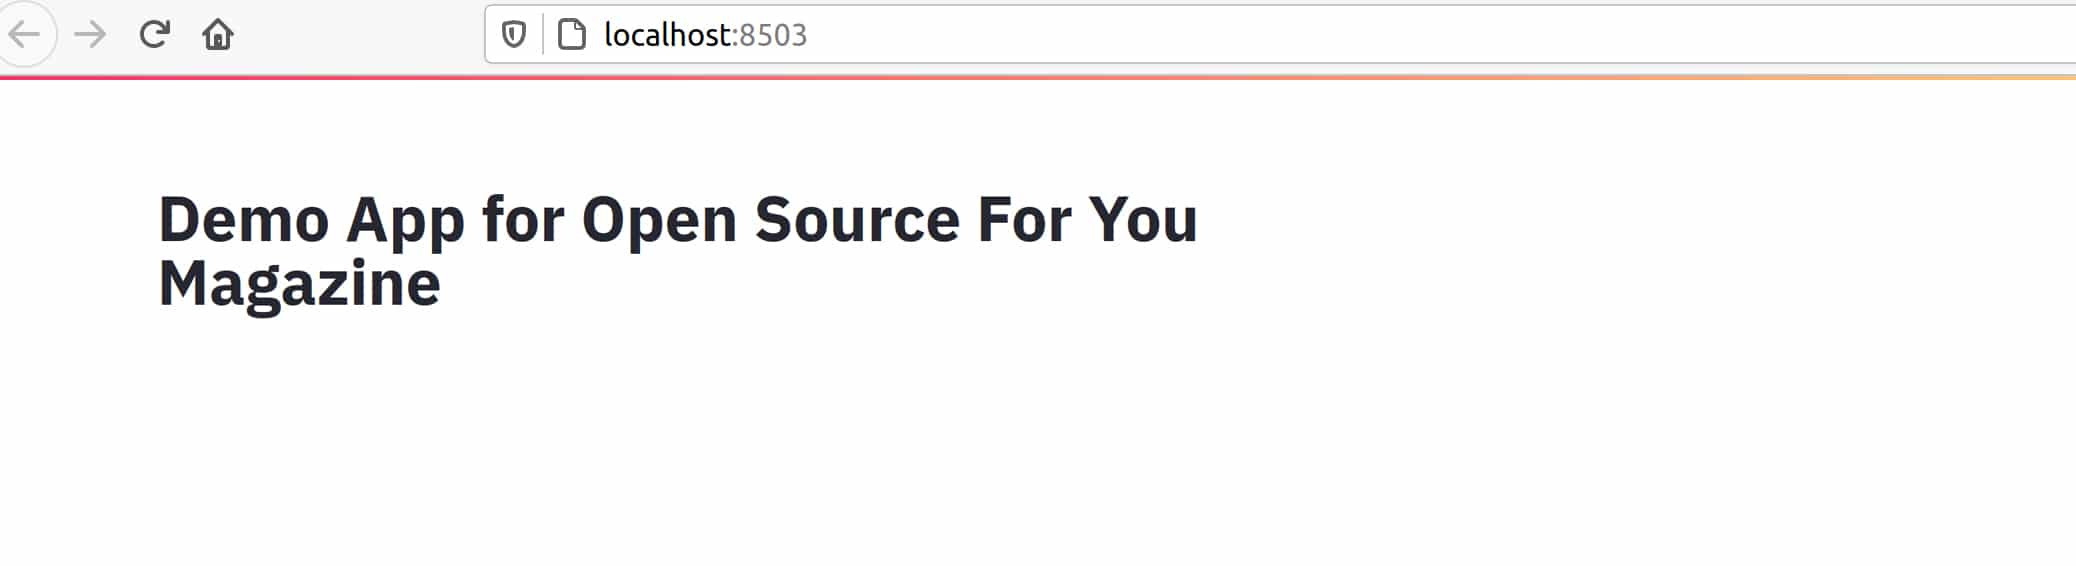
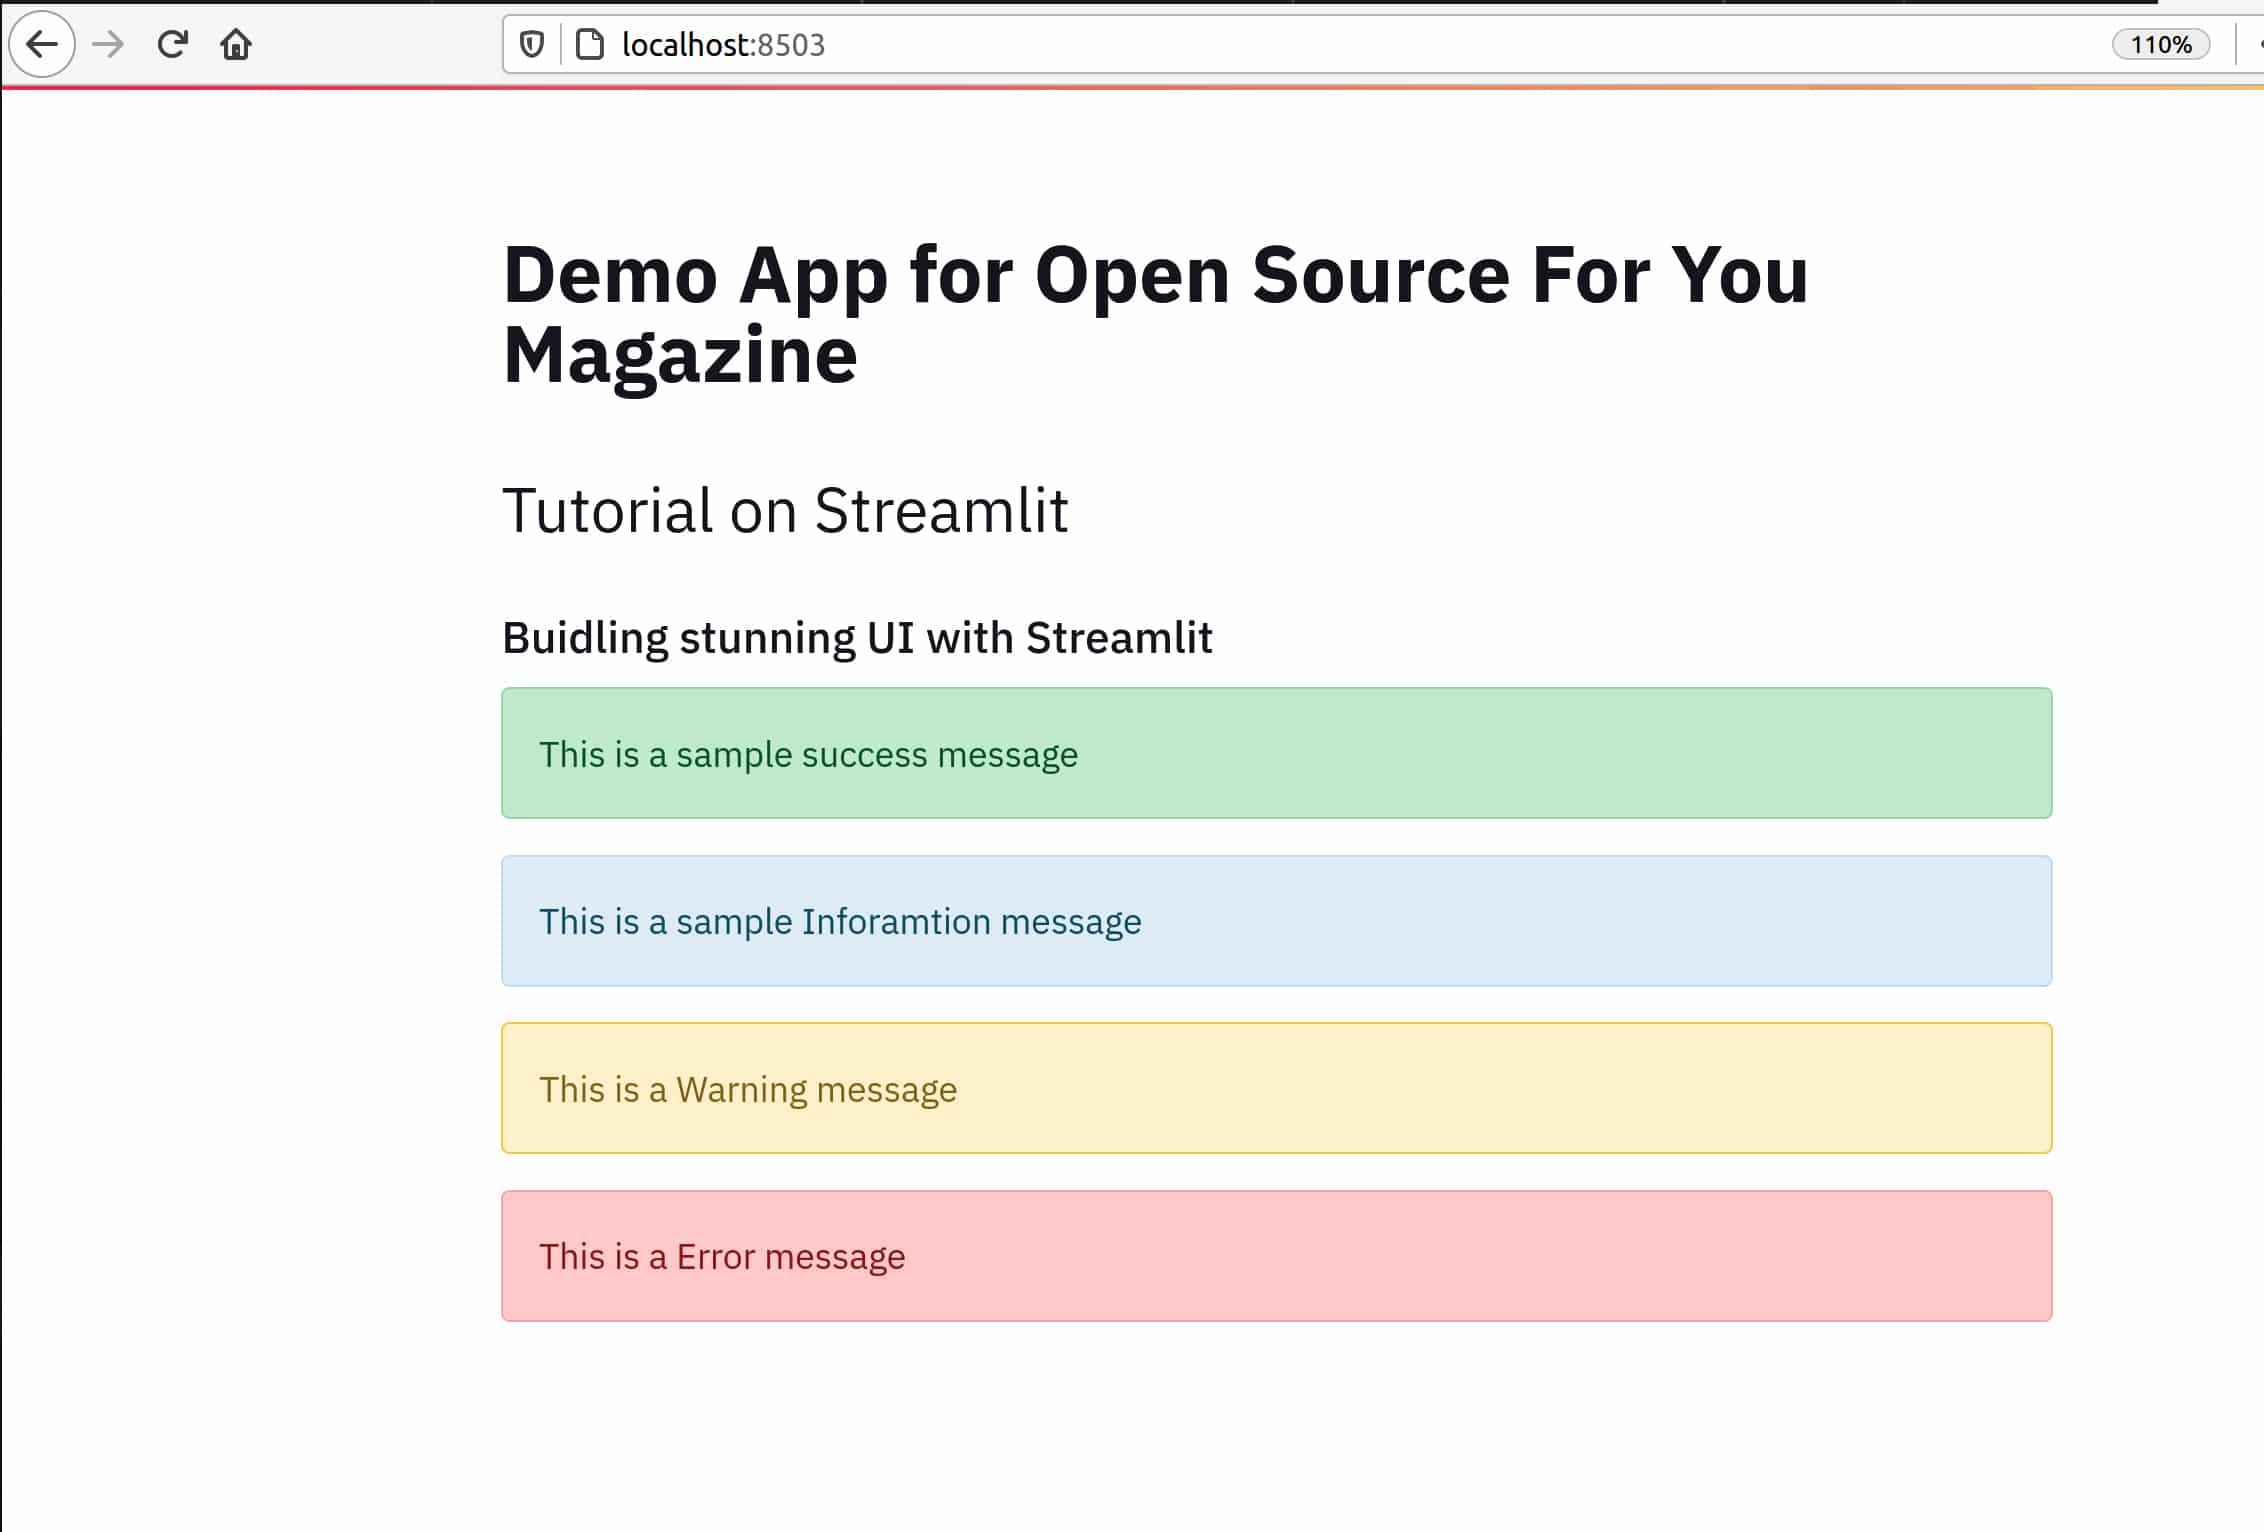
Adding a title: You can add a title to the app with the following code:
import streamlit as st
st.title(“Demo App for Open Source For You Magazine”)
If you see a notification ‘Source File Changed’ in the browser tab, select ‘Always Rerun’. By clicking it, you can see the title of the app (Figure 3).
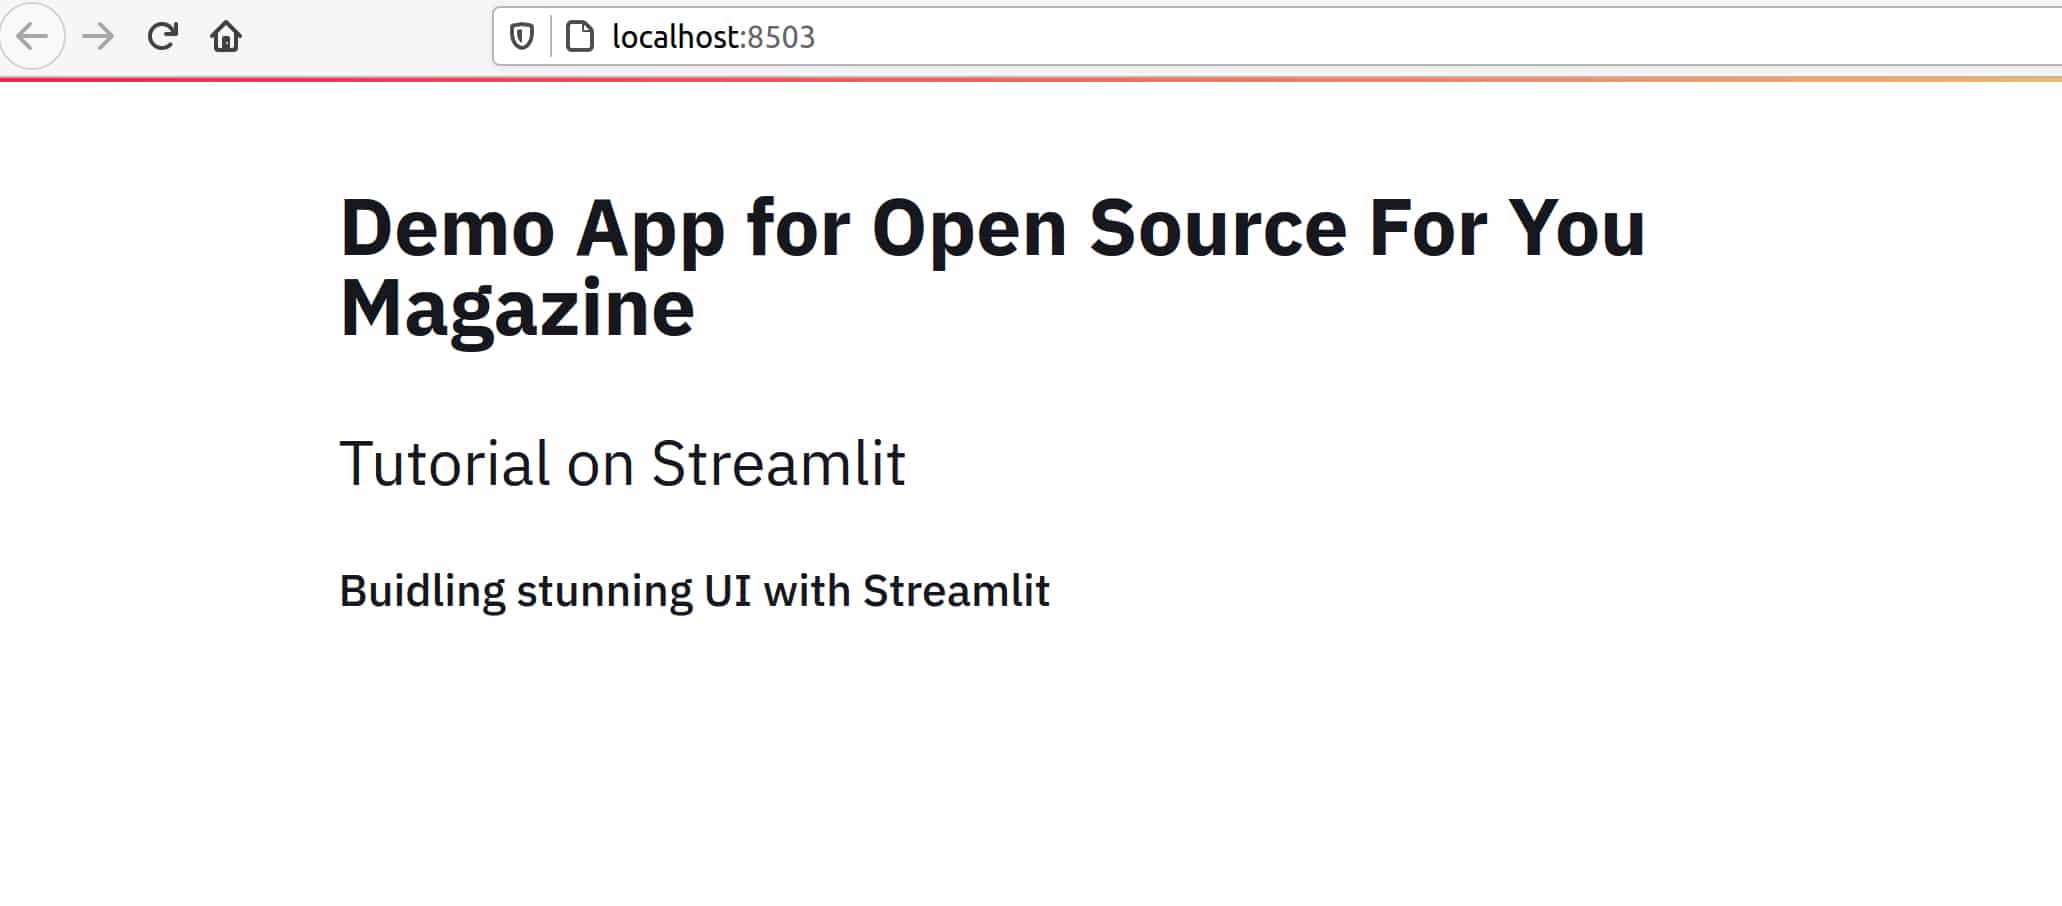
Adding header and sub-header: Heading and sub-heading can be added to the app with the following code:
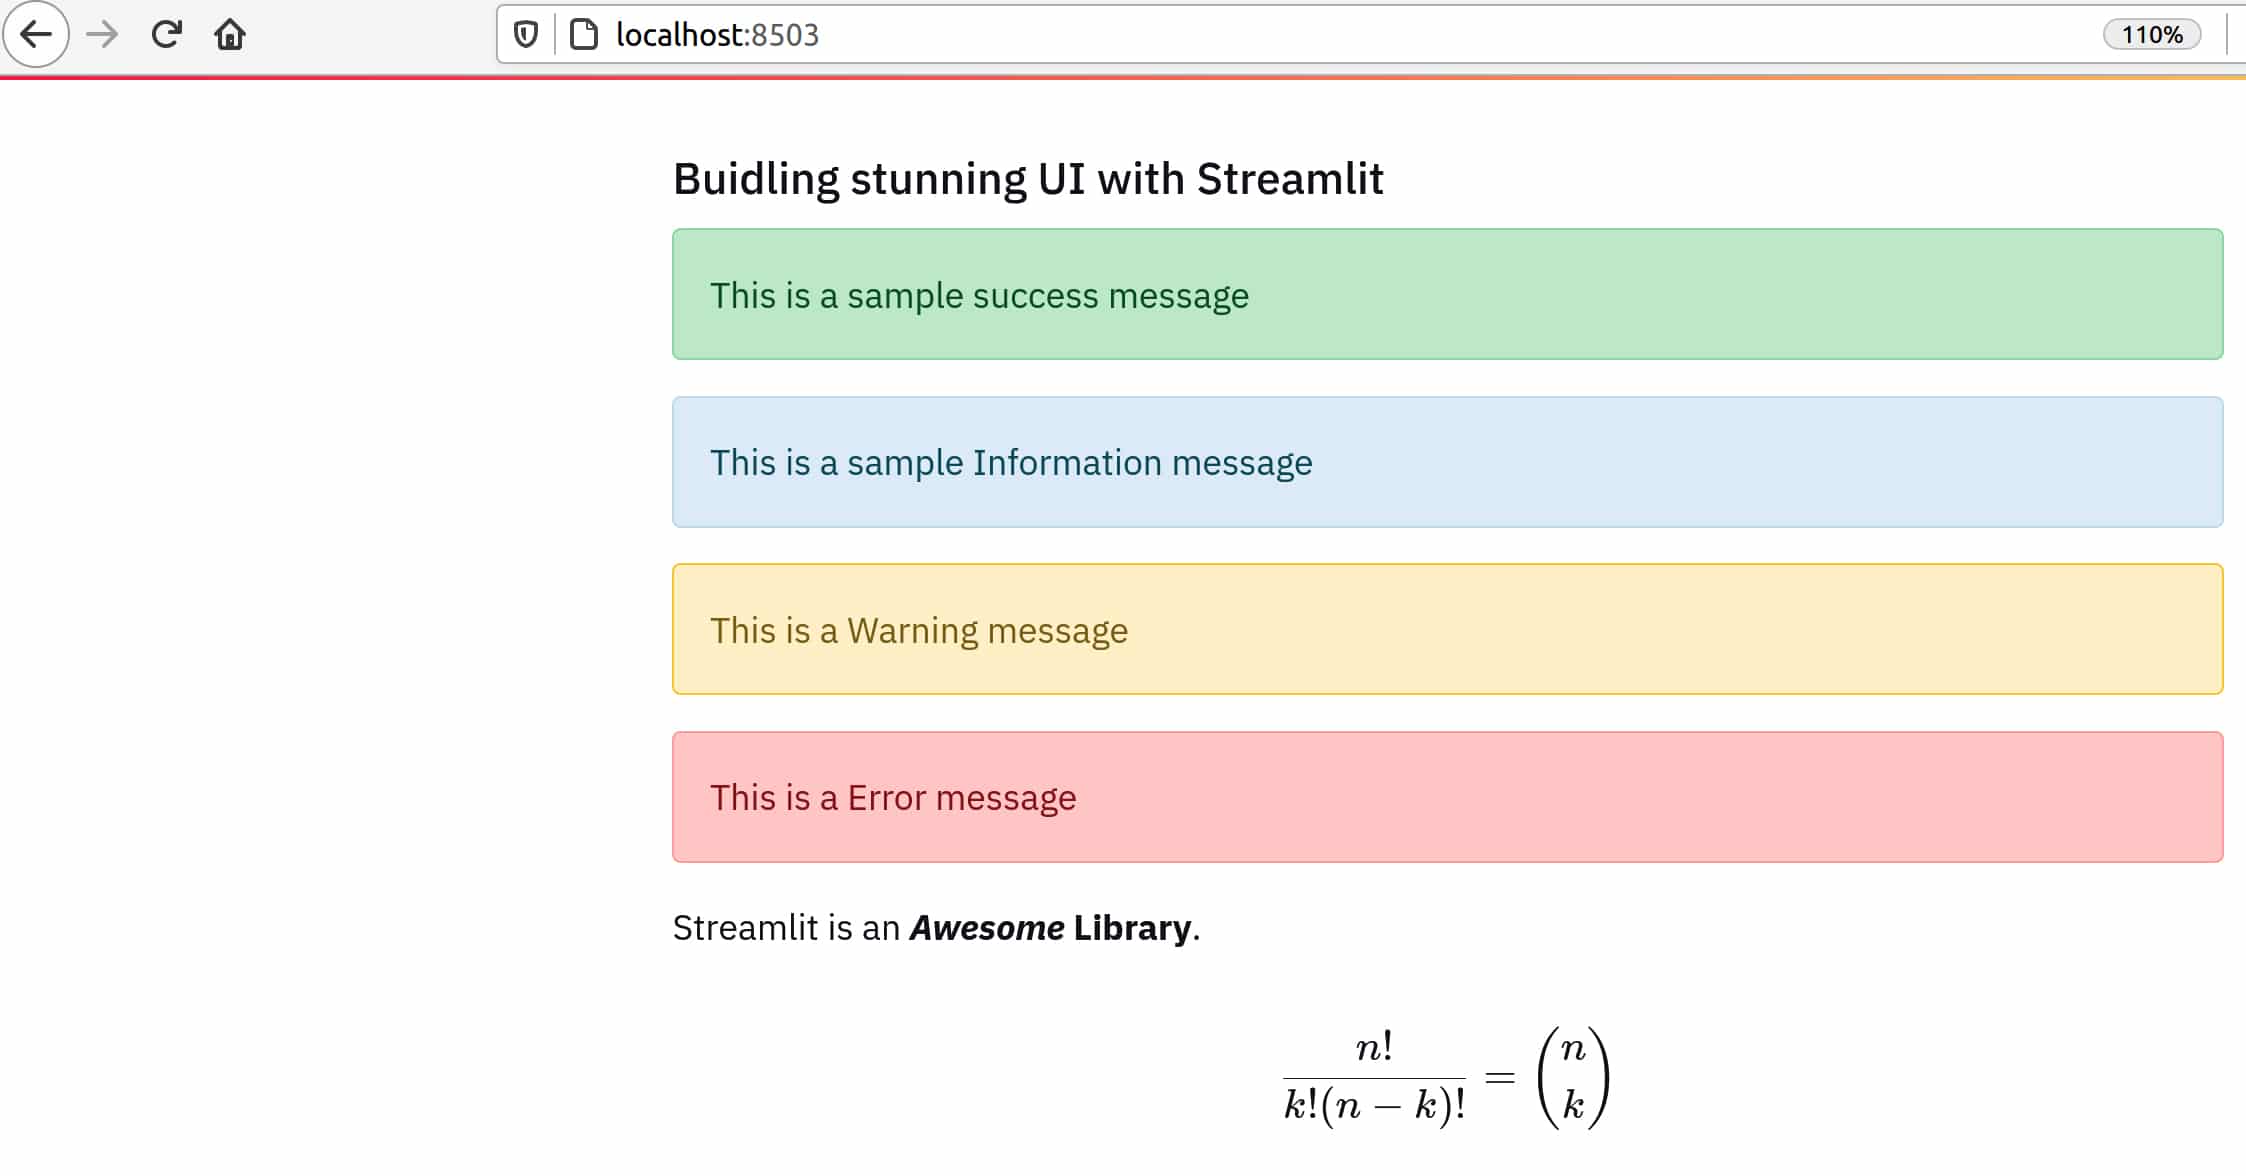
st.header(“Tutorial on Streamlit”)
st.subheader(“Buidling stunning UI with Streamlit”)
The output is shown in Figure 4.
Adding notifications: Streamlit enables you to add notifications of the following categories effortlessly:
- Success
- Info
- Warning
- Error
There are direct methods available to add each of these notifications:
st.success(“This is a sample success message”)
st.info(“This is a sample Inforamation message”)
st.warning(“This is a Warning message”)
st.error(“This is an Error message ”)
You can observe in Figure 5 that these notification messages are rendered with attractive background colours.
Adding markdown: Streamlit allows you to write markdown, as shown below:
st.markdown(‘Streamlit is an **_Awesome_ Library**.’)
Adding LaTex content: LaTex is a powerful documenting tool for scientific publishing. Streamlit allows you to write content formatted with LaTex, as shown below:
st.latex(r’’’ \frac{n!}{k!(n-k)!} = \binom{n}{k} ‘’’)
The output is shown in Figure 6.
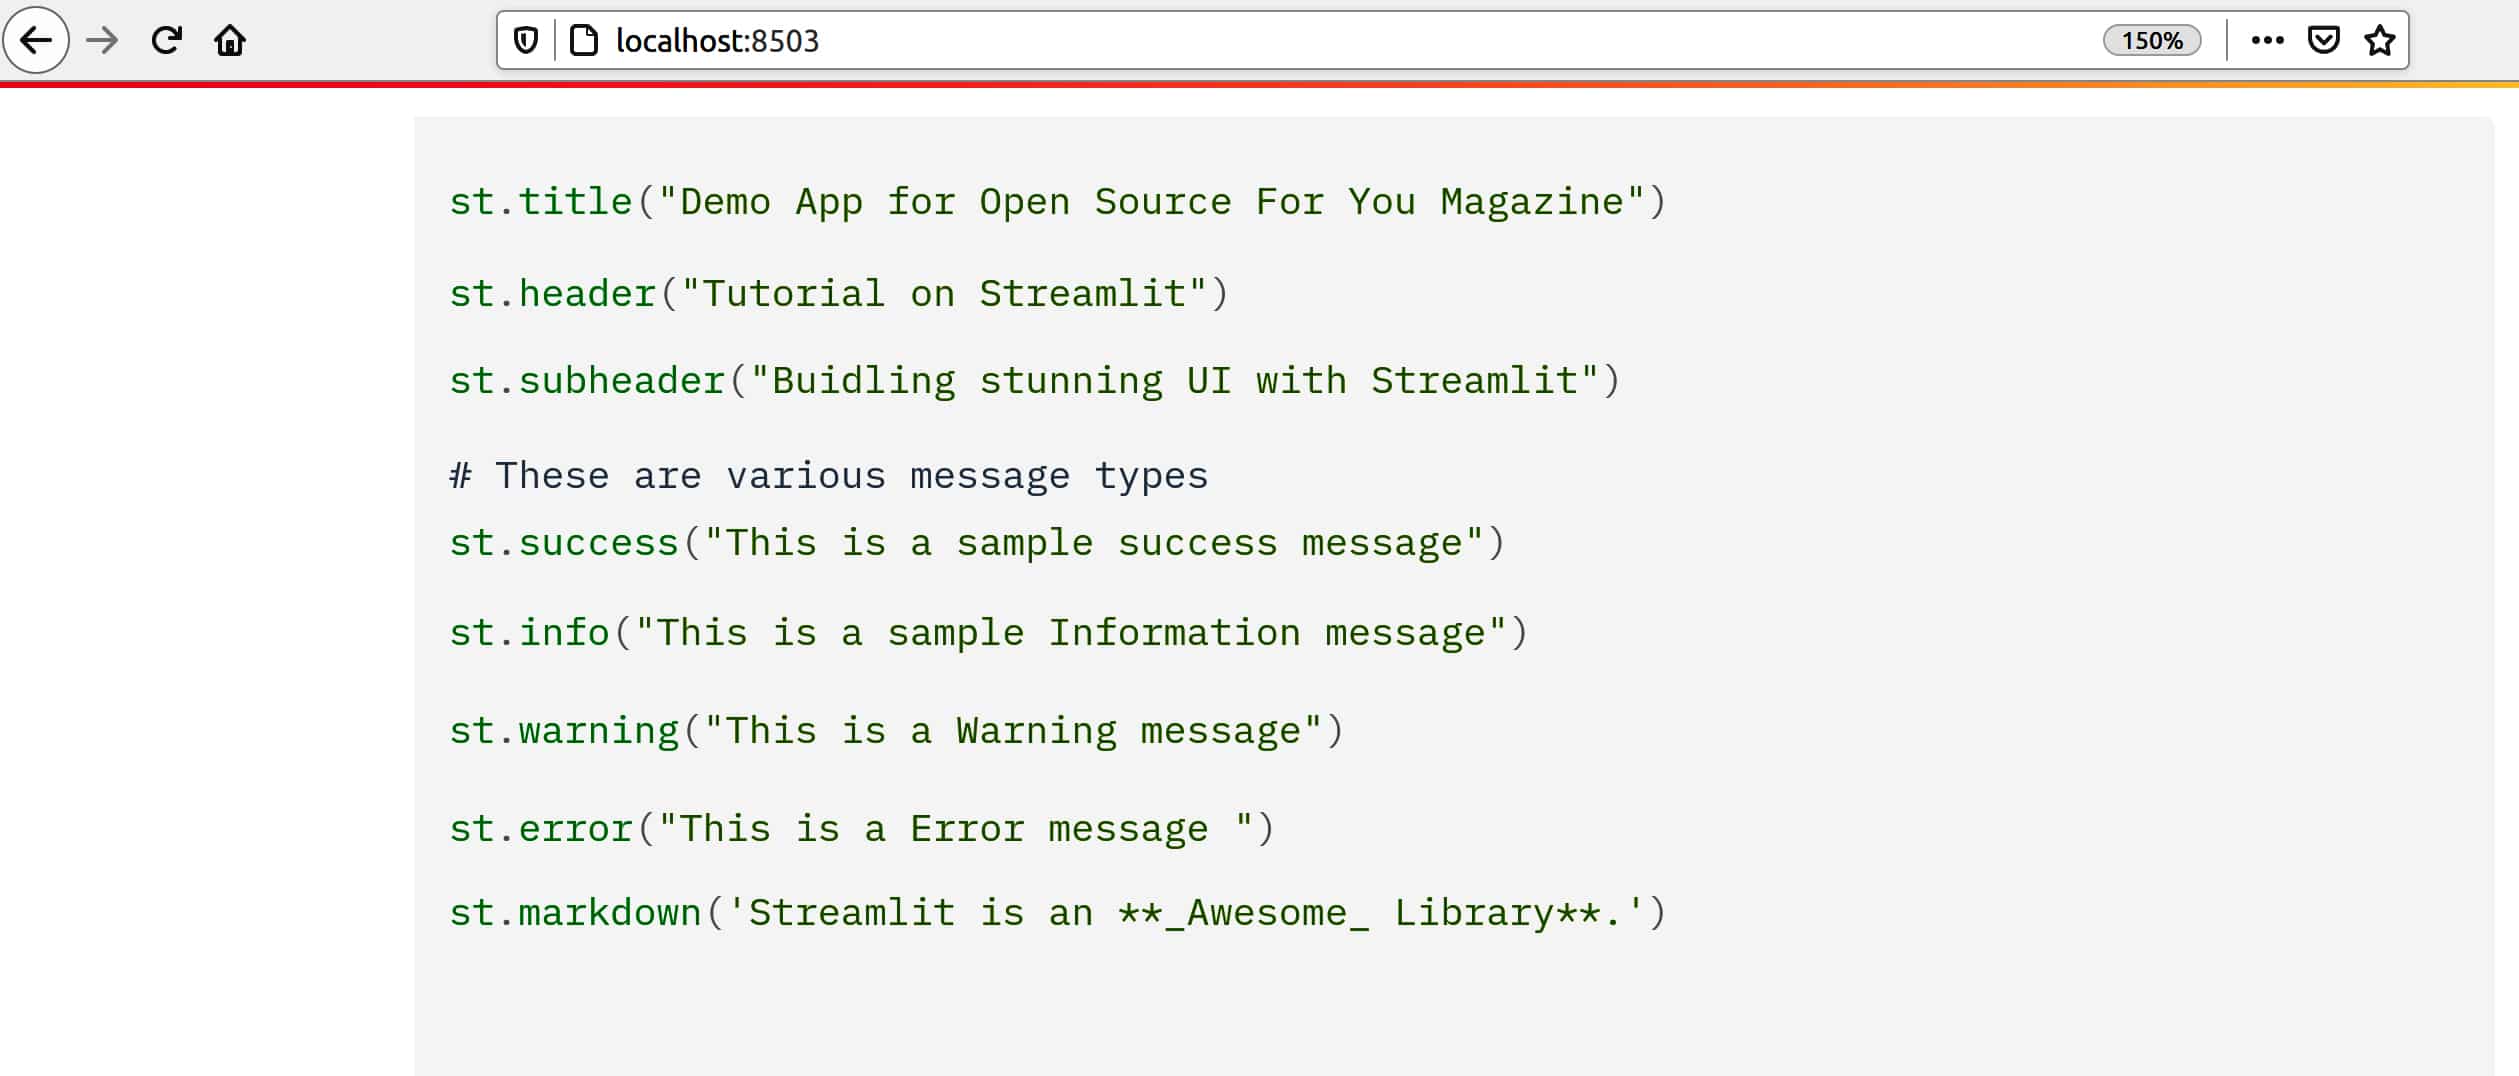
Displaying code with Streamlit
If you need to display some code block, you can use the st.code() function to do it:
code = ‘’’
st.title(“Demo App for Open Source For You Magazine”)
st.header(“Tutorial on Streamlit”)
st.subheader(“Buidling stunning UI with Streamlit”)
# These are various message types
st.success(“This is a sample success message”)
st.info(“This is a sample Information message”)
st.warning(“This is a Warning message”)
st.error(“This is an Error message ”)
st.markdown(‘Streamlit is an **_Awesome_ Library**.’)
‘’’
st.code(code, language=‘python’)
Using a DataFrame and chart
Streamlit enables the usage of data frames and building multiple types of charts with direct functions. A sample code snippet along with the output is shown in Figure 8:
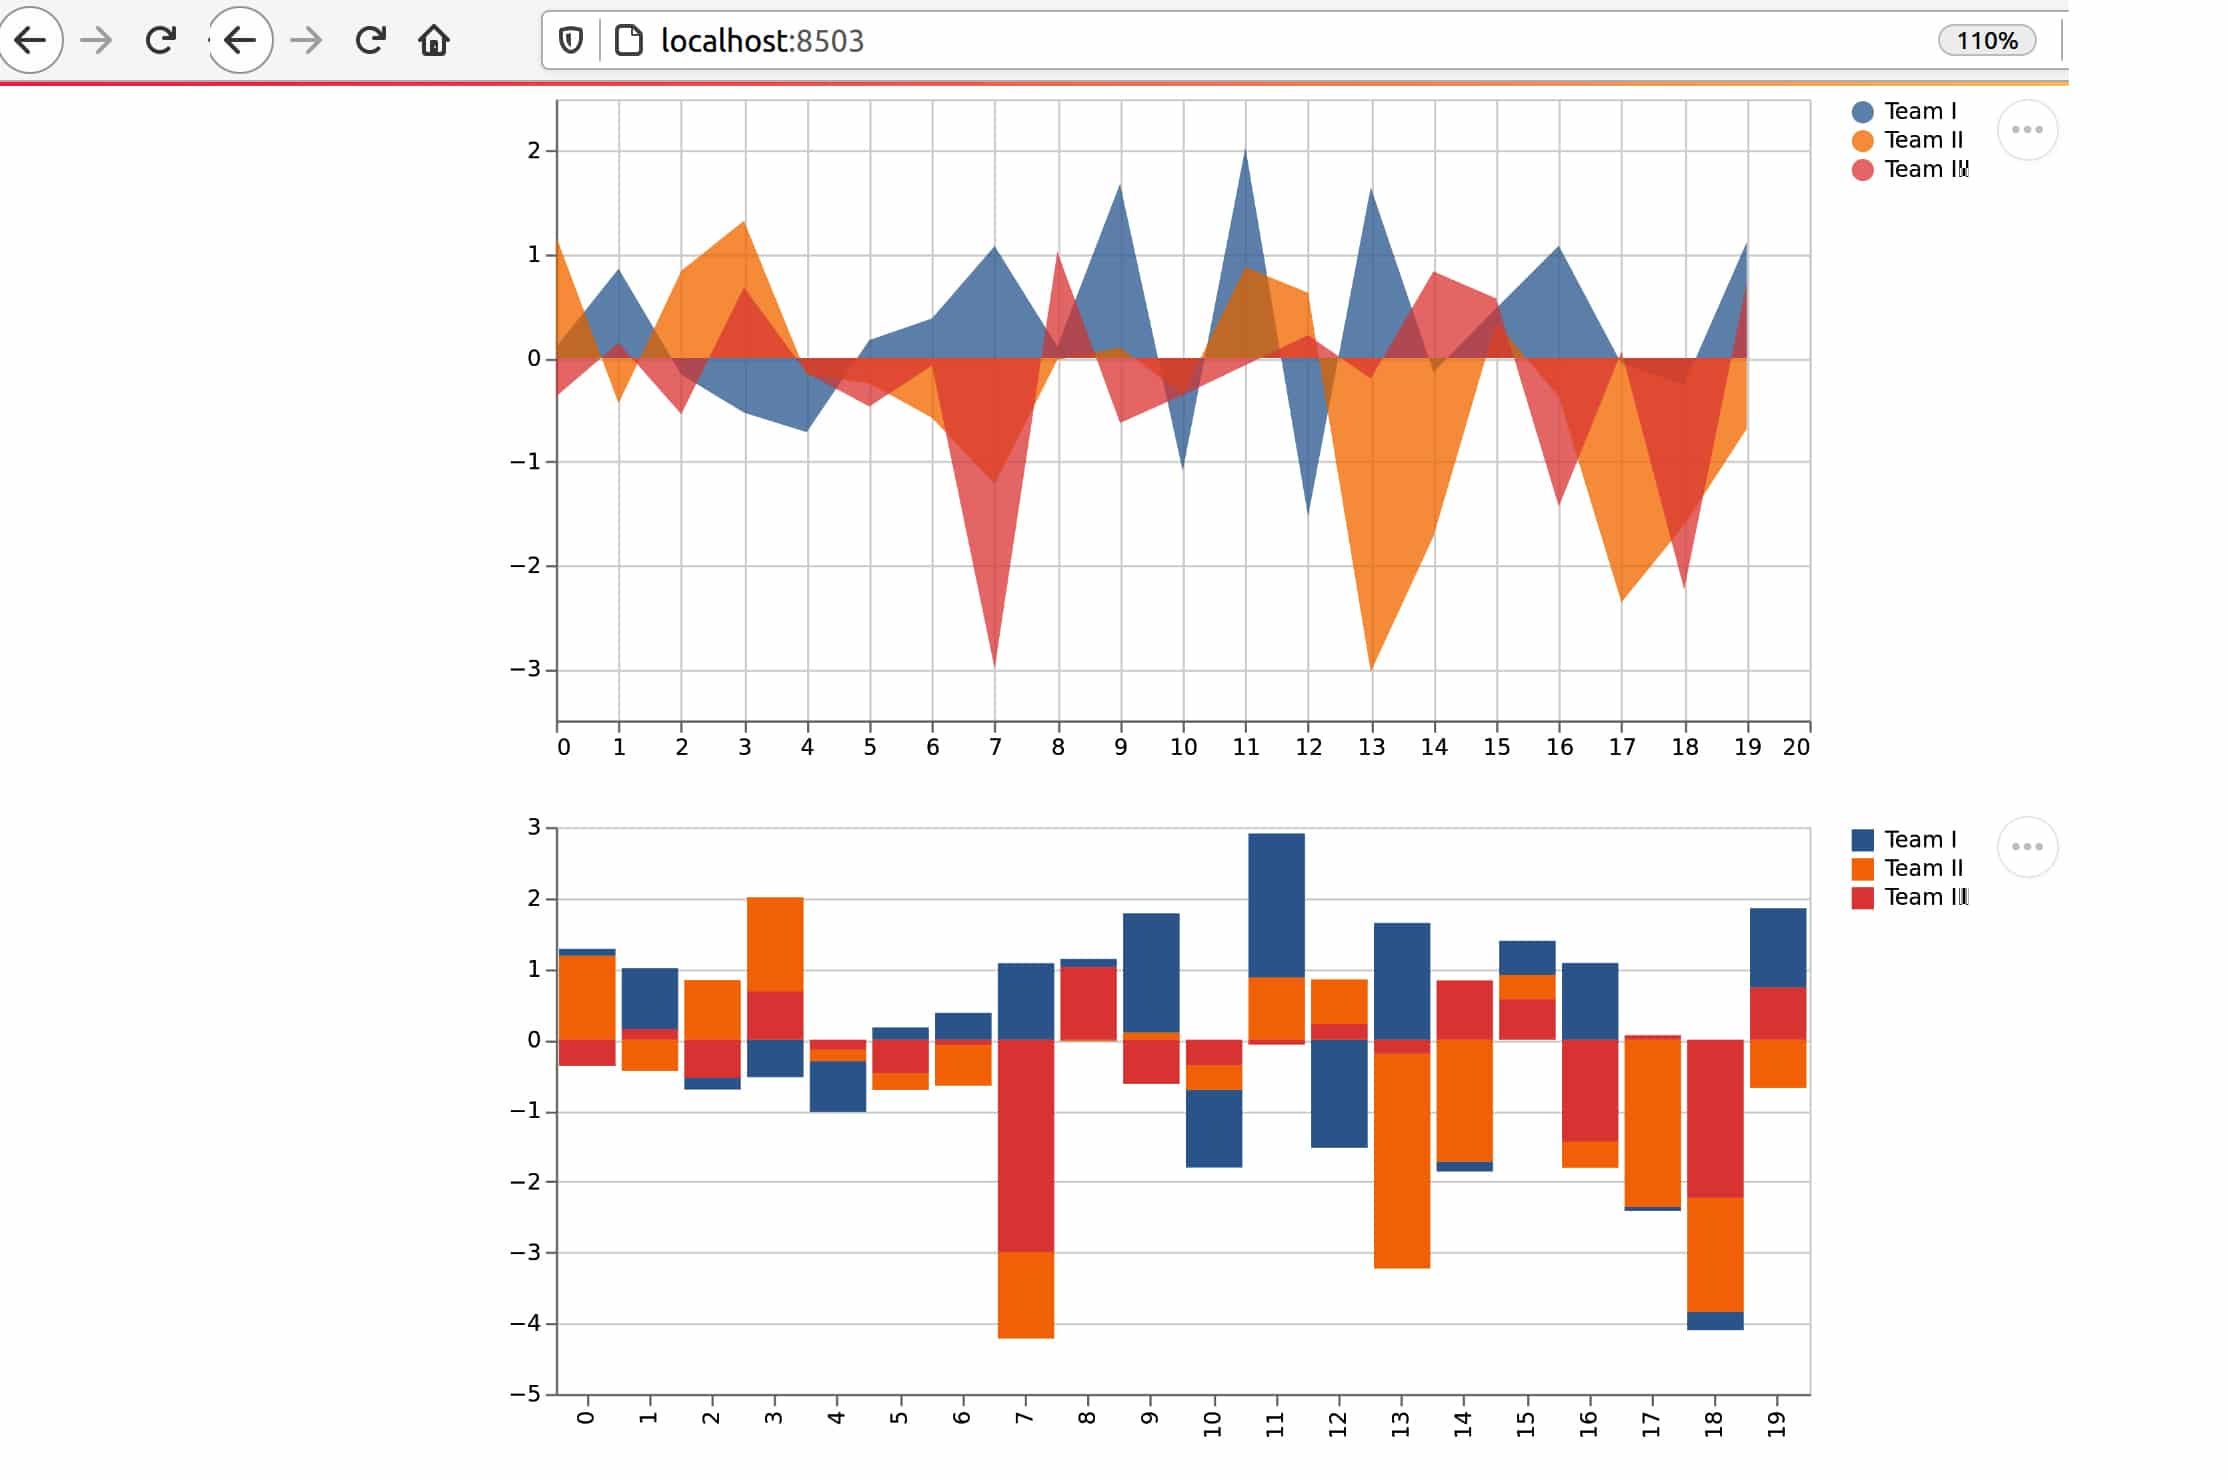
chart_data = pd.DataFrame(
np.random.randn(20, 3),
columns=[‘Team I’, ‘Team II’, ‘Team III’])
st.area_chart(chart_data)
st.bar_chart(chart_data)
Images and other media
Streamlit enables inclusion of images and other media such as audio and video in the interface (Figure 9):

from PIL import Image
image = Image.open(‘mywindow.jpeg’)
st.image(image, caption=’A Rainy Day at Pondicherry University’, use_column_width=True)

audio_file = open(‘isai.ogg’, ‘rb’)
audio_bytes = audio_file.read()
st.audio(audio_bytes, format=’audio/ogg’)
Interactive widgets
Widgets are the most important user interface components. Streamlit has various widgets, which are explained in this section.
To add an interactive button, type:
if st.button(“Click Me”):
st.success(“Successfully Completed”)
A button with the label ‘Click Me’ is included (Figure 10). When the user clicks the button, the message ‘Successfully Completed’ appears with the success notification explained earlier.
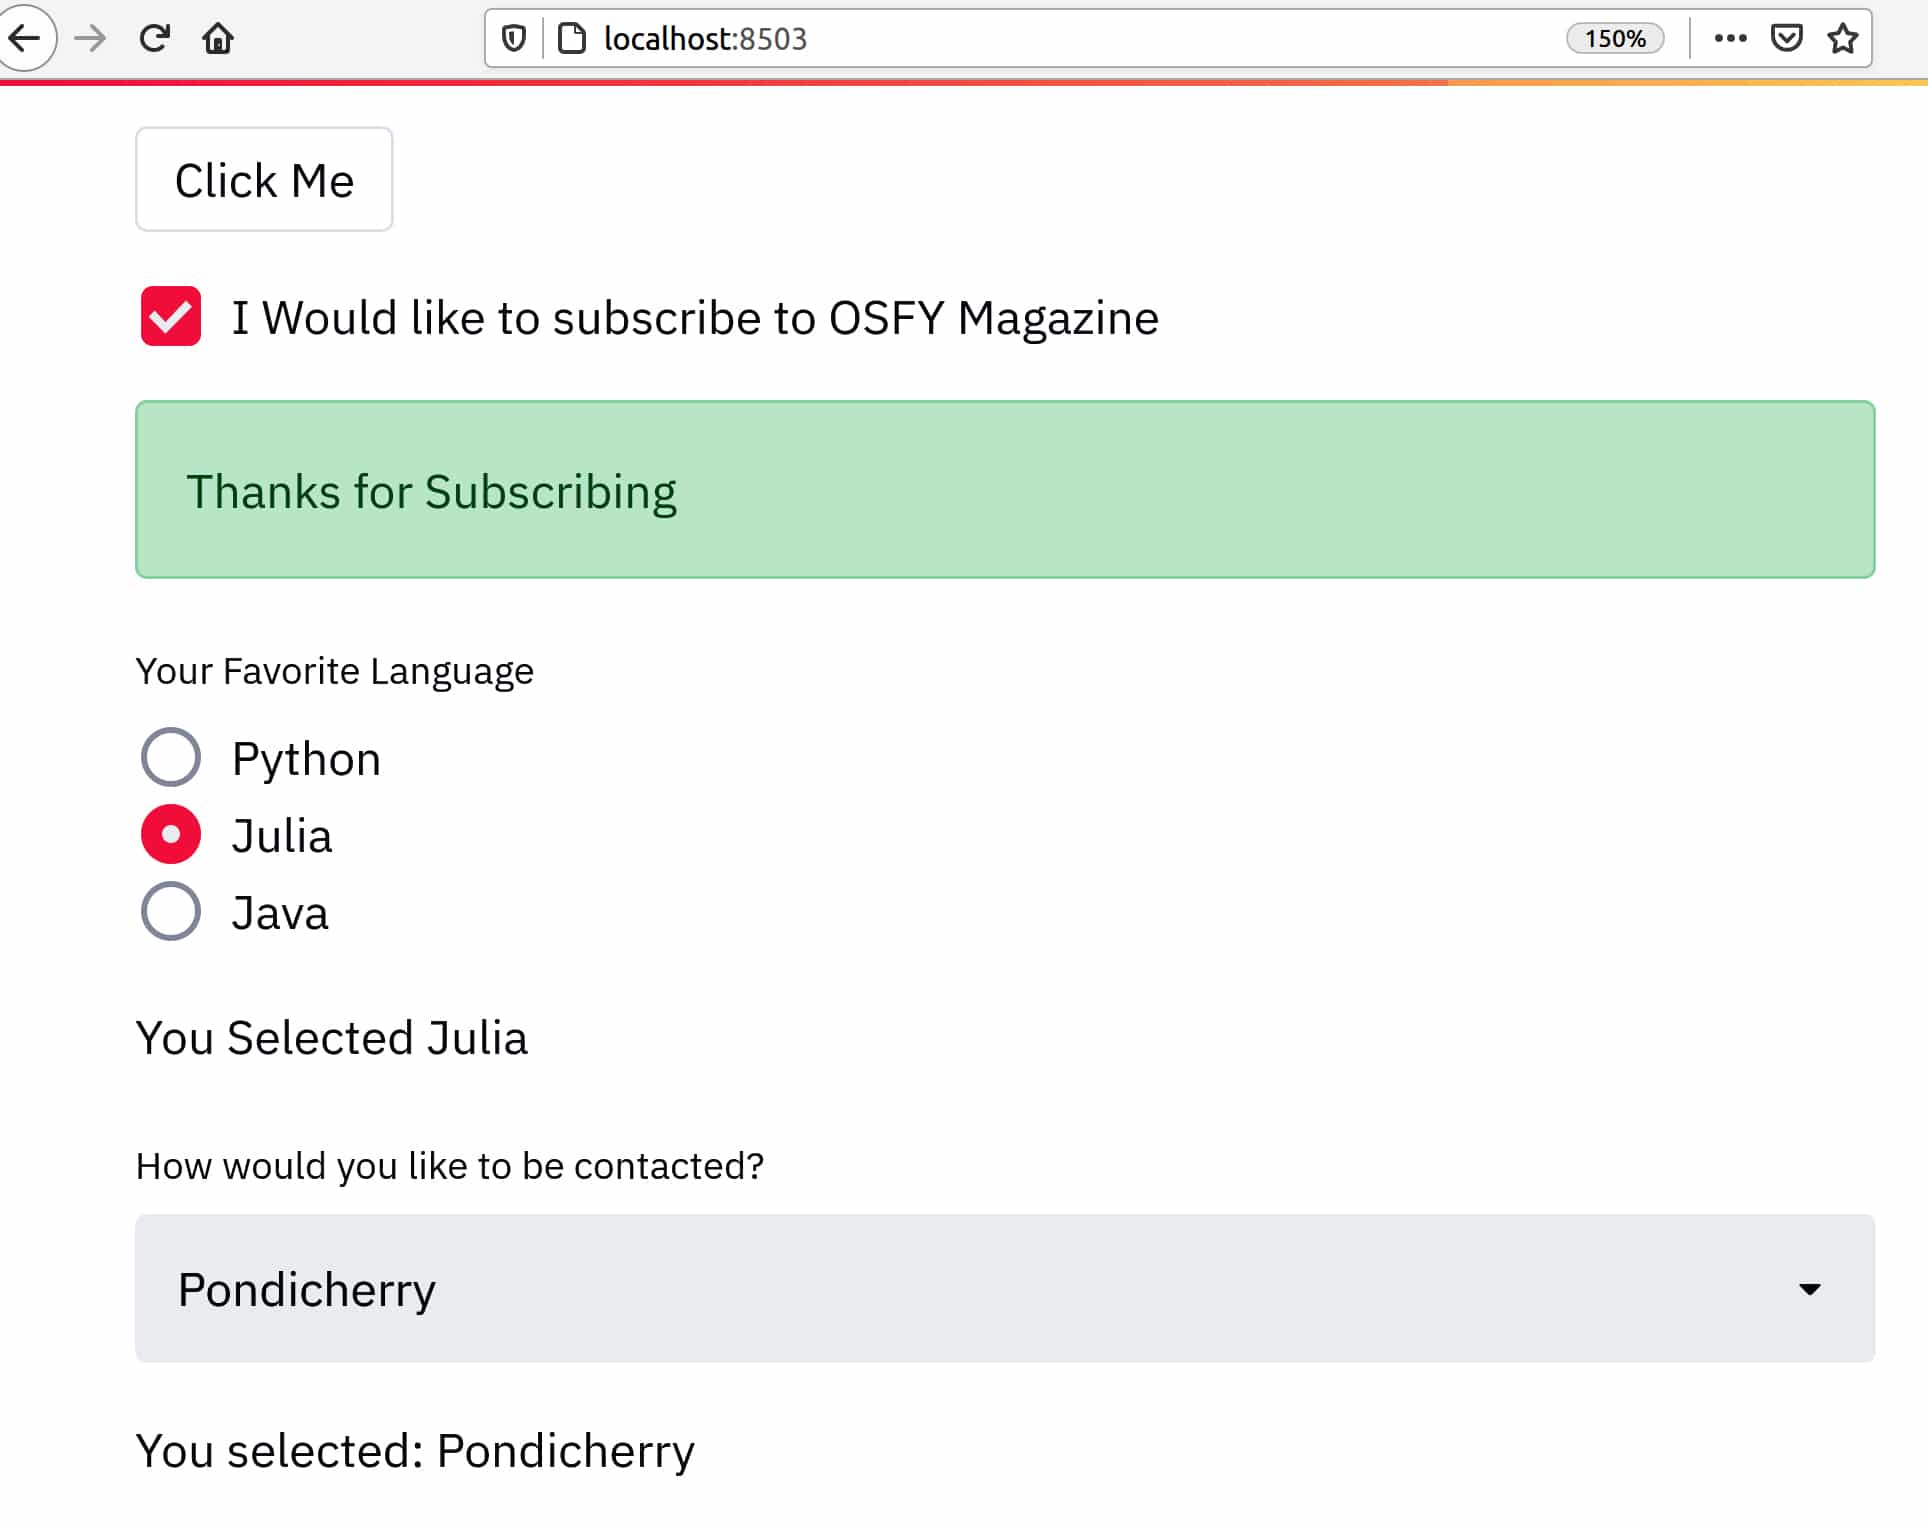
To add an interactive CheckBox, type:
sub = st.checkbox(‘I Would like to subscribe to OSFY Magazine’)
if sub:
st.write(‘Thanks for Subscribing’)
To add an interactive radio button, write the following code:
lang = st.radio( “Your Favourite Language”, (‘Python’, ‘Julia’, ‘Java’))
if lang == ‘Python’:
st.write(‘You selected Python.’)
if lang == ‘Julia’:
st.write(“You Selected Julia”)
if lang == ‘Java’:
st.write(“You Selected Java”)
To add a Select box, type:
city = st.selectbox(‘How would you like to be contacted?’, (‘Chennai’, ‘Bangalore’, ‘New Delhi’, ‘Mumbai’, ‘Kolkata’, ‘Pondicherry’))
st.write(‘You selected:’, city)
To add a Multiselect box, type:
options = st.multiselect(‘What are your favourite colours?’, [‘Green’, ‘Yellow’, ‘Red’, ‘Blue’, ‘Purple’, ‘Magenta’])
st.write(‘You selected:’, options)
A slider can be added simply with the following code snippet:
level = st.slider(‘Select Your Expertise Level?’, 1, 10, 6)
st.write(“You are at Level:”, level)
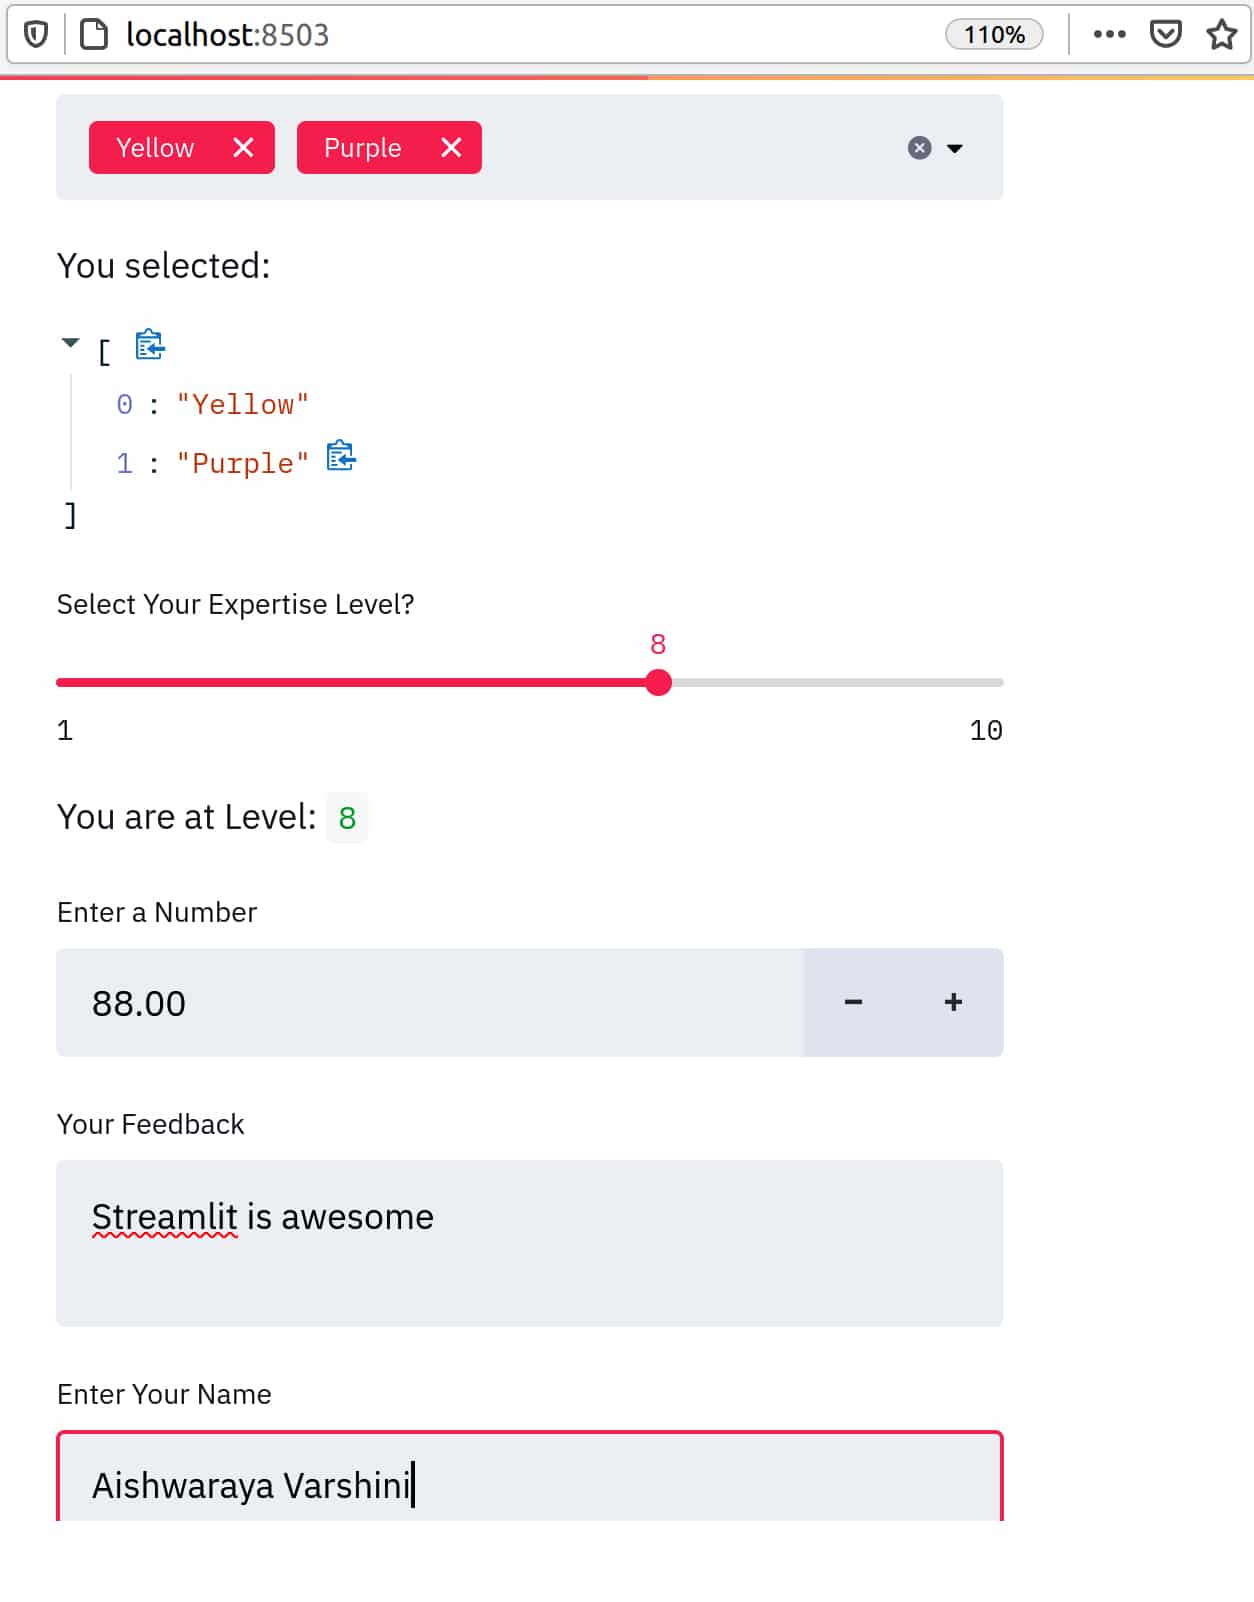
The number input, text input and text area can be added to get the input from the user:
num = st.number_input(“Enter a Number”)
txt = st.text_area(“Your Feedback”)
inp = st.text_input(“Enter Your Name”)
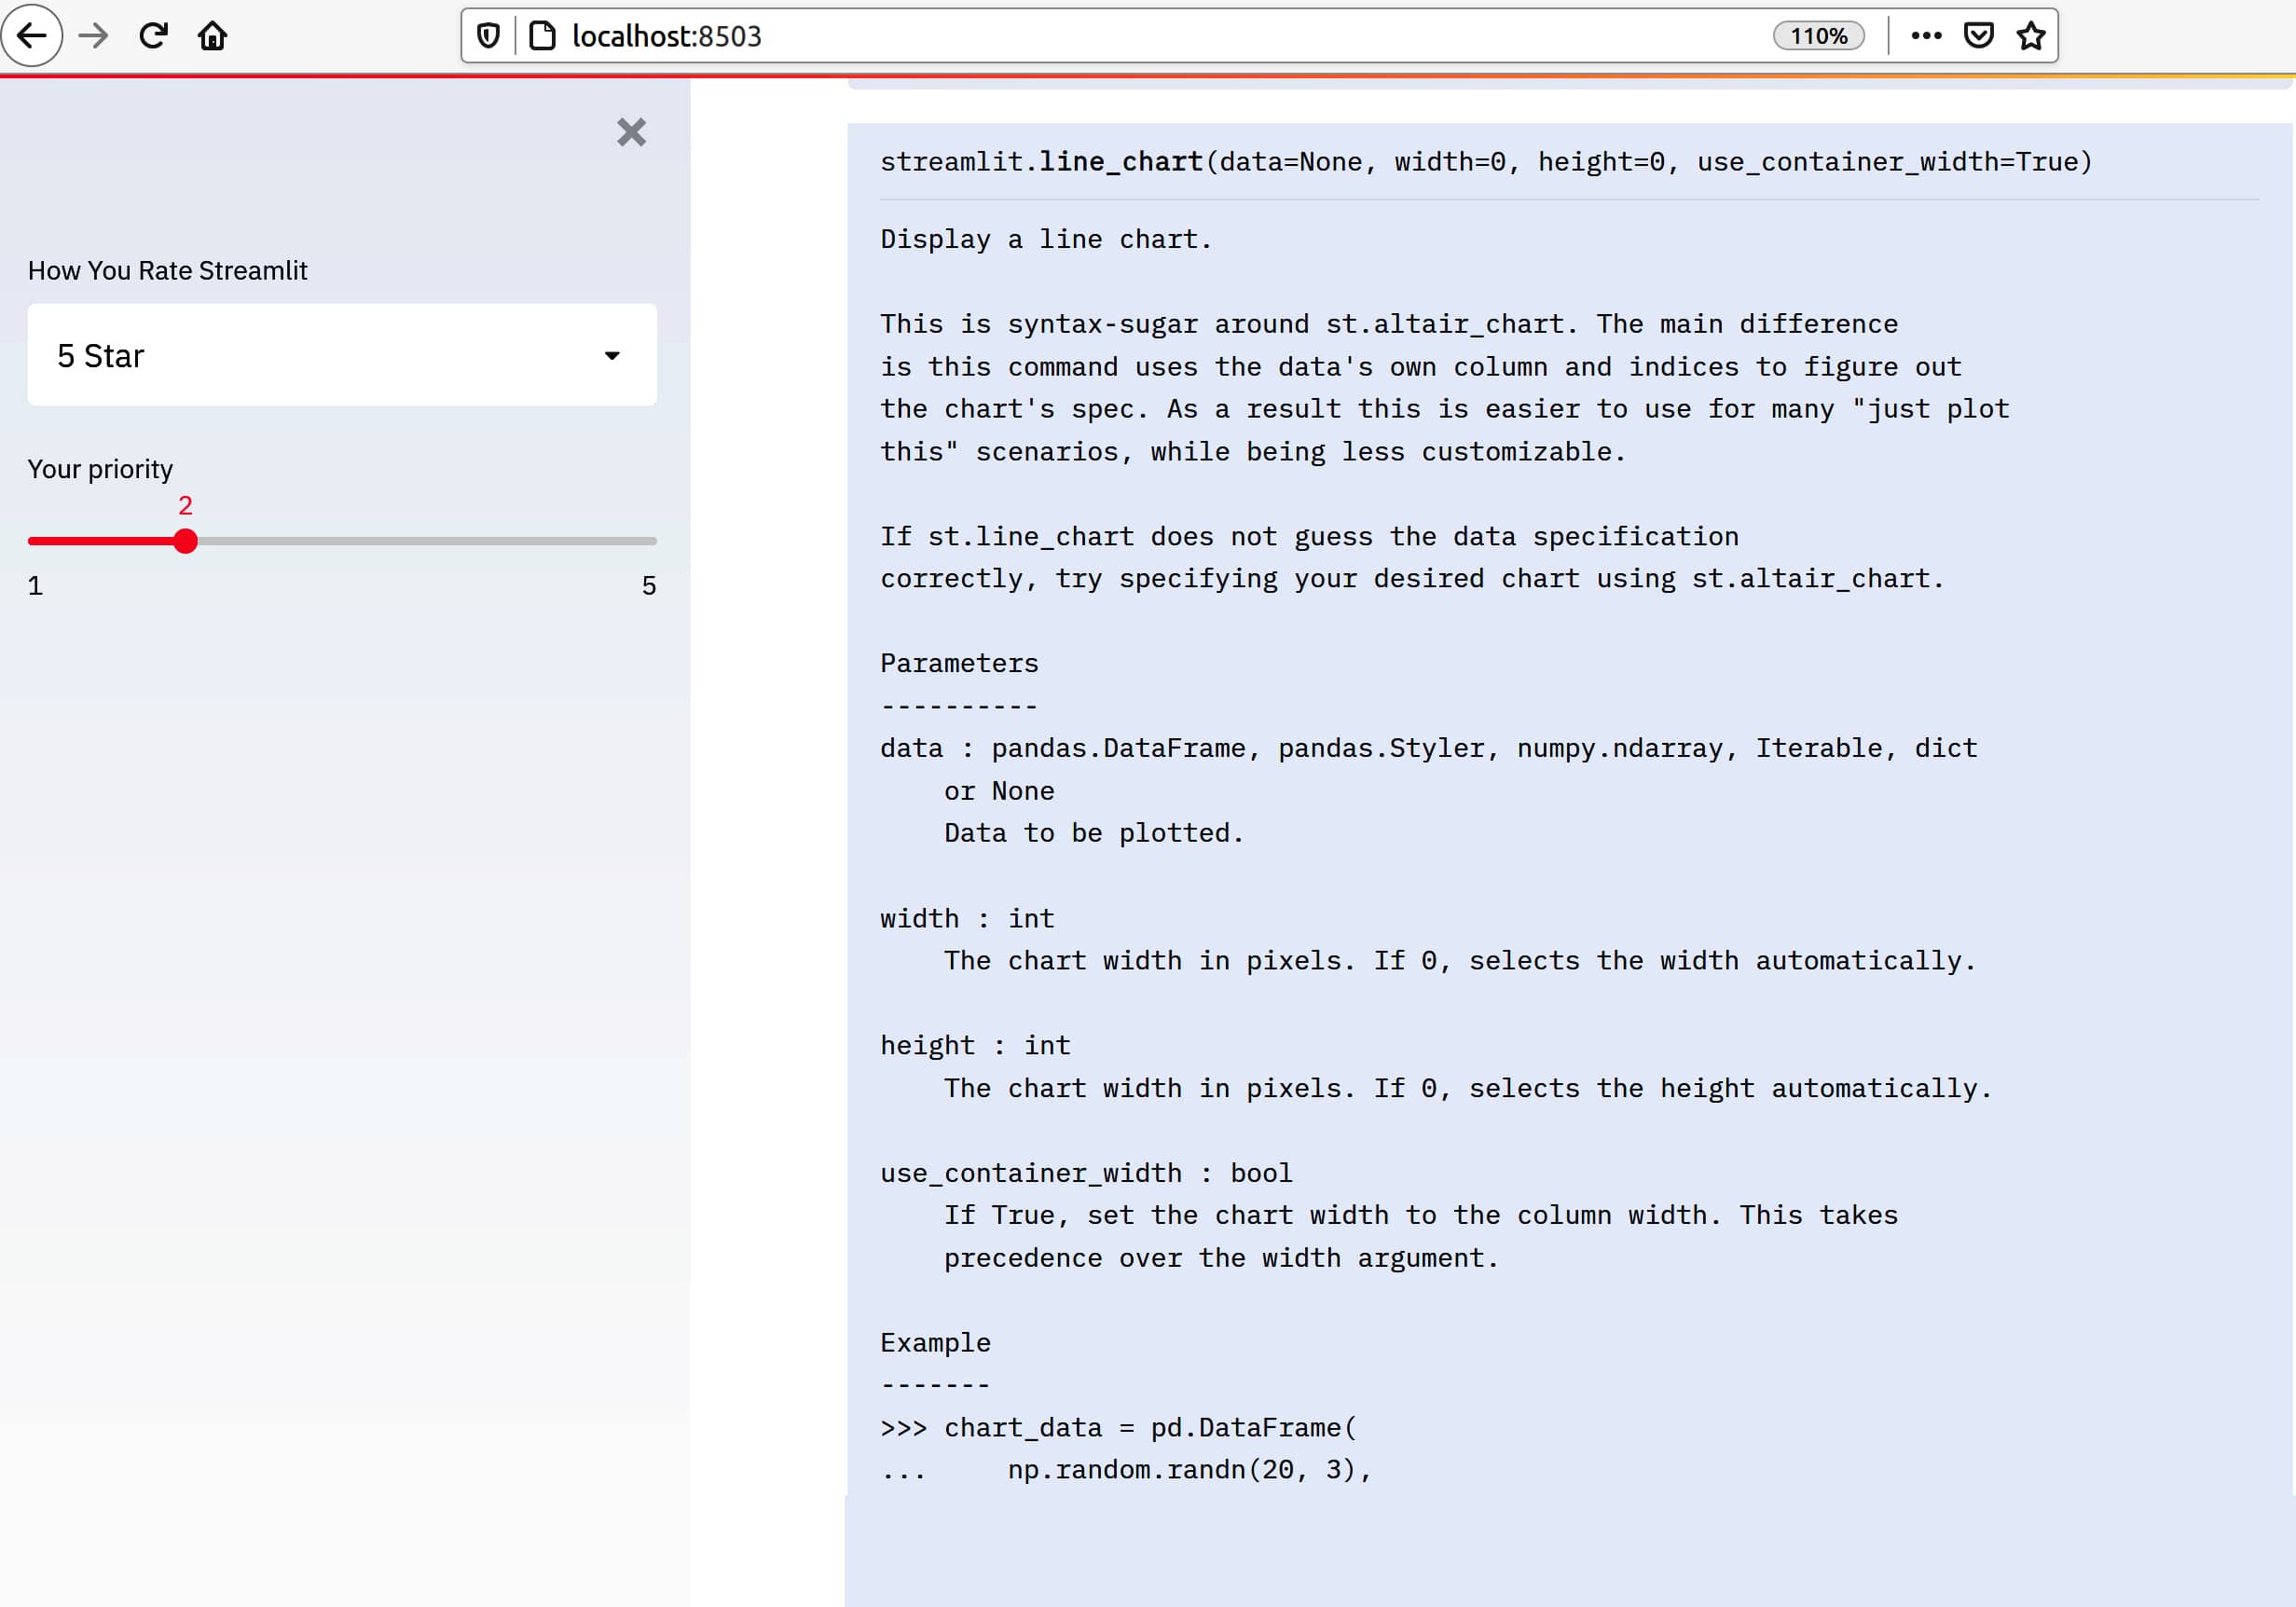
In many applications it would be easier to have a sidebar. In Streamlit, a sidebar can be easily added (Figure 12):
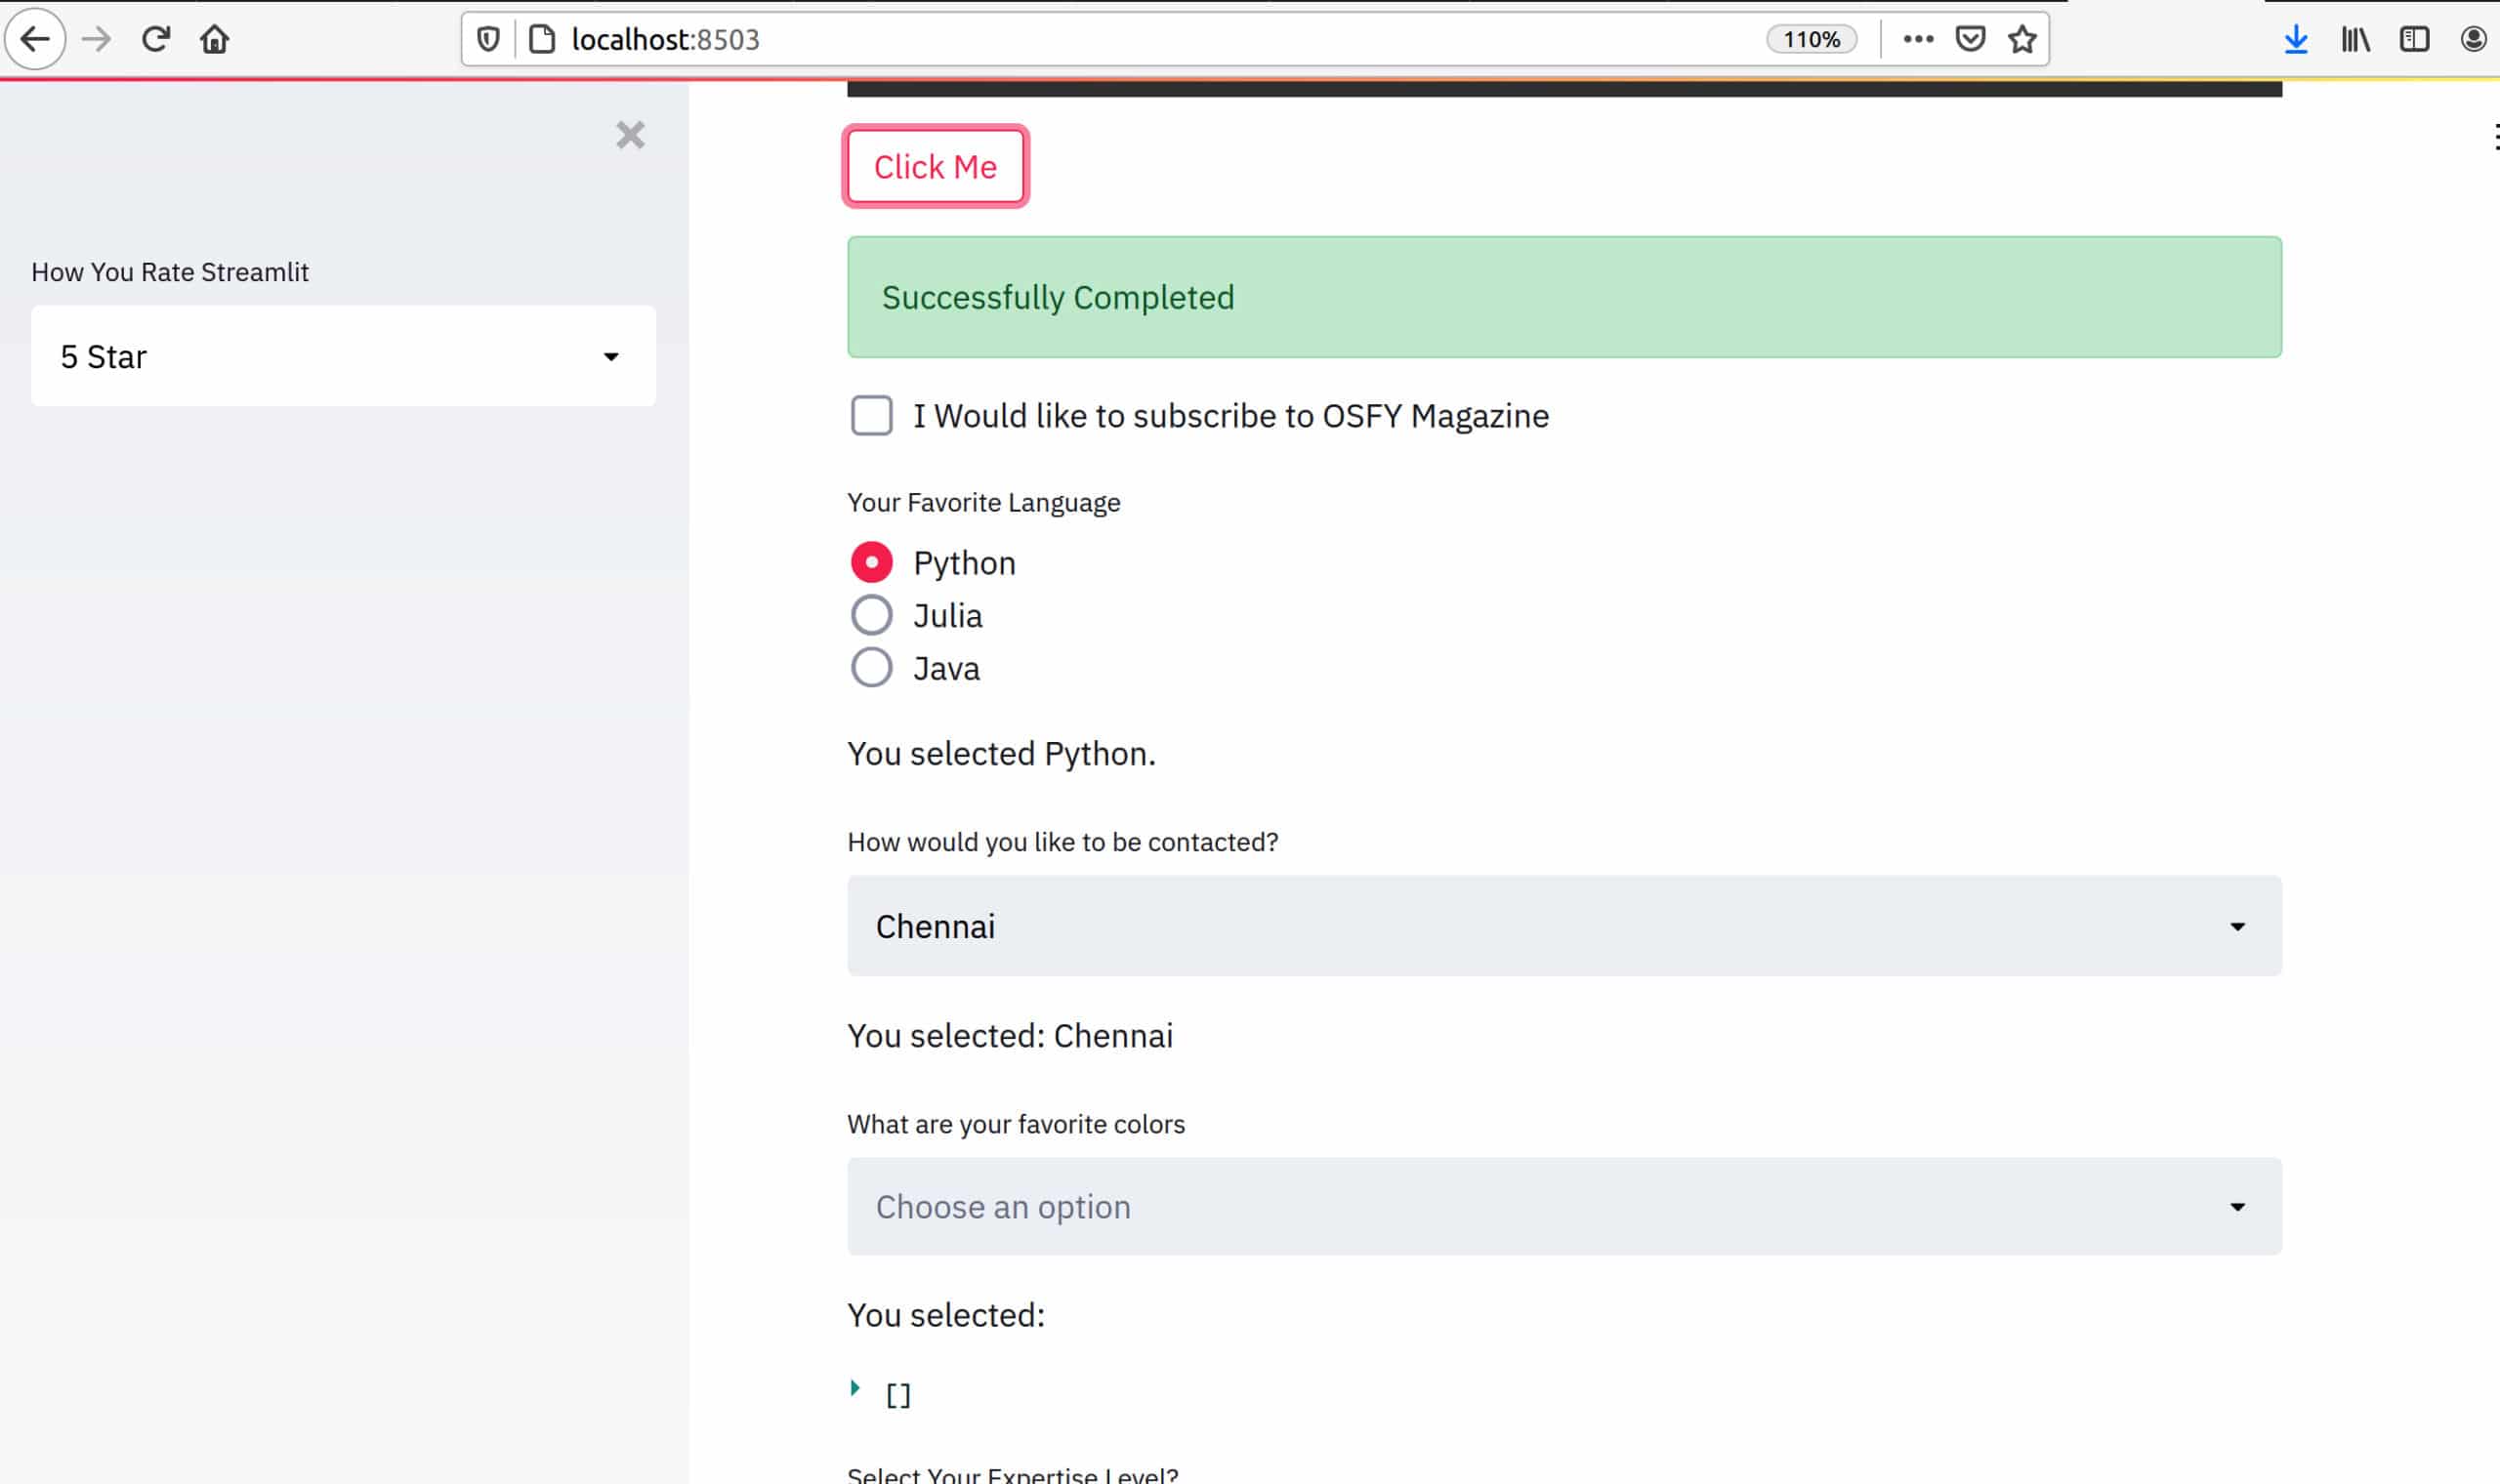
add_selectbox = st.sidebar.selectbox(
“How You Rate Streamlit?”,
(“1 Star”, “2 Star”, “3 Star”, “4 Star”, “5 Star”)
)
To get help information, st.help() can be used, as shown below:
st.help(st.line_chart)
This will display the help information about st.line_chart() (see Figure 13).
This article provides an introduction to Streamlit. The official documentation carries loads of easy-to-follow information (https://docs.streamlit.io/en/stable/api.html). Streamlit is a powerful library to build Web apps for your data science/machine learning projects, and you can easily convert your existing scripts into awesome graphical user interface based tools with its help. Don’t miss experimenting with the Streamlit library!


