


Welcome to a new series on ‘R, statistics and machine learning’. R is a programming language that was primarily designed for statistical computing and graphics.
It is a multi-paradigm programming language that supports an imperative, object-oriented, array and functional style of programming. R is dynamically typed and is primarily written in C, Fortran and R itself.
R is an official GNU package and is released under the GNU GPL v2 licence. It was first released in 1993 and the latest stable release is 4.0.4. The official home page of the R project is https://www.r-project.org/. In this new series of articles, we will explore the syntax, semantics of R and also the various libraries available for statistics, graphics and machine learning.
Installation
Parabola GNU/Linux-libre: You can install R on Parabola GNU/Linux-libre using the Pacman package manager, as shown below:
$ sudo pacman -S r
The latest version that gets installed is 4.0.4-1, as indicated below:
extra/r 4.0.4-1 [installed]
Language and environment for statistical computing and graphics
Debian/Ubuntu: The ‘r-base’ package needs to be installed on Ubuntu to get R in your system:
$ sudo apt install r-base
Fedora: The latest R version can be installed on Fedora using:
$ sudo dnf install R
Mac OS X: The ‘R.APP’ application can be installed from https://mac.r-project.org/ for Mac OS X. The website provides both the -devel and -stable releases for installation. Periodic nightly builds are made for the R releases with a .pkg file. Please note that these releases for Mac OS X are still experimental in nature.
Windows: The ‘bin/windows/base’ directory at https://cran.r-project.org/mirrors.html provides an R-4.0.4-win.exe executable for R on Windows. If you like to test the latest software, you can install the ‘r-patched’ or ‘r-devel’ snapshot releases as well. R on Windows is supported from Windows 7 or later, and the installation takes at least 150MB of disk space.
Emacs: As an Emacs user, you can install the ‘Emacs Speaks Statistics’ (ESS) package that provides support for working on R source files. The add-on includes syntax highlighting, code formatting, searching for documentation, displaying results, etc. The project website is available at https://ess.r-project.org/. With a Cask setup, you can simply add the following to your Cask file to install ESS:
(depends-on “ess”)
You can also execute R code in an Emacs Org Babel code block. The following needs to be added to your Emacs configuration file:
(org-babel-do-load-languages
‘org-babel-load-languages
‘((emacs-lisp . t)
(R . t)))
Consider the given code snippet in an Emacs Org file. When you use C-c C-c in the code block, it will execute the commands in an R environment and produce the result:
#+BEGIN_SRC R
sqrt(2)
#+END_SRC
#+RESULTS:
: 1.4142135623731
Usage
On Parabola GNU/Linux-libre, open a terminal and type ‘R’ at the shell prompt to invoke the R interpreter as shown below:
$ R
R version 4.0.4 (2021-02-15) -- “Lost Library Book”
Copyright (C) 2021 The R Foundation for Statistical Computing
Platform: x86_64-pc-linux-gnu (64-bit)
R is free software and comes with ABSOLUTELY NO WARRANTY.
You are welcome to redistribute it under certain conditions.
Type license() or licence() for distribution details.
Natural language support but running in an English locale
R is a collaborative project with many contributors.
Type ‘contributors()’ for more information and
‘citation()’ on how to cite R or R packages in publications.
Type demo() for some demos, help() for on-line help, or
help.start() for an HTML browser interface to help.
Type ‘q()’ to quit R.
>
You can type q() at the prompt to exit from the session. It will then ask you if you would like to save the workspace image and you can either press y or n.
> q()
Save workspace image? [y/n/c]: n
$
You can obtain the version of R that is installed from the terminal prompt using the R –version command, as shown below:
$ R --version
R version 4.0.4 (2021-02-15) -- “Lost Library Book”
Copyright (C) 2021 The R Foundation for Statistical Computing
Platform: x86_64-pc-linux-gnu (64-bit)
R is free software and comes with ABSOLUTELY NO WARRANTY.
You are welcome to redistribute it under the terms of the
GNU General Public License versions 2 or 3.
For more information about these matters see
https://www.gnu.org/licenses/.
If you are at the R prompt, you can obtain the version information with the ‘version’ built-in as follows:
> version
_
platform x86_64-pc-linux-gnu
arch x86_64
os linux-gnu
system x86_64, linux-gnu
status
major 4
minor 0.4
year 2021
month 02
day 15
svn rev 80002
language R
version.string R version 4.0.4 (2021-02-15)
nickname Lost Library Book
There is also built-in help documentation that you can use with the ‘help’ function as mentioned below:
> help()
help package:utils R Documentation
Documentation
Description:
‘help’ is the primary interface to the help systems.
Usage:
help(topic, package = NULL, lib.loc = NULL,
verbose = getOption(“verbose”),
try.all.packages = getOption(“help.try.all.packages”),
help_type = getOption(“help_type”))
Arguments:
topic: usually, a name or character string specifying the topic for which help is sought. A character string (enclosed in explicit single or double quotes) is always taken as naming a topic.
If the value of ‘topic’ is a length-one character vector the
topic is taken to be the value of the only element.
Otherwise ‘topic’ must be a name or a reserved word (if
syntactically valid) or character string.
See ‘Details’ for what happens if this is omitted.
…
You can search for specific help using the help.search function, as shown below:
> help.search(“histogram”)
Help files with alias or concept or title matching ‘histogram’ using
fuzzy matching:
graphics::hist Histograms
graphics::hist.POSIXt Histogram of a Date or Date-Time Object
graphics::plot.histogram
Plot Histograms
Aliases: plot.histogram, lines.histogram
grDevices::nclass.Sturges
Compute the Number of Classes for a Histogram
KernSmooth::dpih Select a Histogram Bin Width
lattice::histogram Histograms and Kernel Density Plots
Aliases: histogram, histogram.factor, histogram.numeric,
histogram.formula
lattice::panel.histogram
Default Panel Function for histogram
Aliases: panel.histogram
lattice::prepanel.default.bwplot
Default Prepanel Functions
Aliases: prepanel.default.histogram
MASS::hist.scott Plot a Histogram with Automatic Bin Width
Selection
MASS::ldahist Histograms or Density Plots of Multiple Groups
MASS::truehist Plot a Histogram
Type ‘?PKG::FOO’ to inspect entries ‘PKG::FOO’, or ‘TYPE?PKG::FOO’ for
entries like ‘PKG::FOO-TYPE’.
The information on operators (arithmetic, for example) can be obtained with the question mark symbol followed by the operator, enclosed within back quotes as illustrated below:
> ?`%%`
Arithmetic package:base R Documentation
Arithmetic Operators
Description:
These unary and binary operators perform arithmetic on numeric or
complex vectors (or objects which can be coerced to them).
Usage:
+ x
- x
x + y
x - y
x * y
x / y
x ^ y
x %% y
x %/% y
Arguments:
x, y: numeric or complex vectors or objects which can be coerced to
such, or other objects for which methods have been written.
The ‘base’ package in R comes with a lot of demos that you can try out from the R console. You can list them using the demo function:
> demo()
Demos in package ‘base’:
error.catching More examples on catching and handling errors
is.things Explore some properties of R objects and
is.FOO() functions. Not for newbies!
recursion Using recursion for adaptive integration
scoping An illustration of lexical scoping.
Demos in package ‘graphics’:
Hershey Tables of the characters in the Hershey vector
fonts
Japanese Tables of the Japanese characters in the
Hershey vector fonts
graphics A show of some of R’s graphics capabilities
image The image-like graphics builtins of R
persp Extended persp() examples
plotmath Examples of the use of mathematics annotation
Demos in package ‘grDevices’:
colors A show of R’s predefined colors()
hclColors Exploration of hcl() space
…
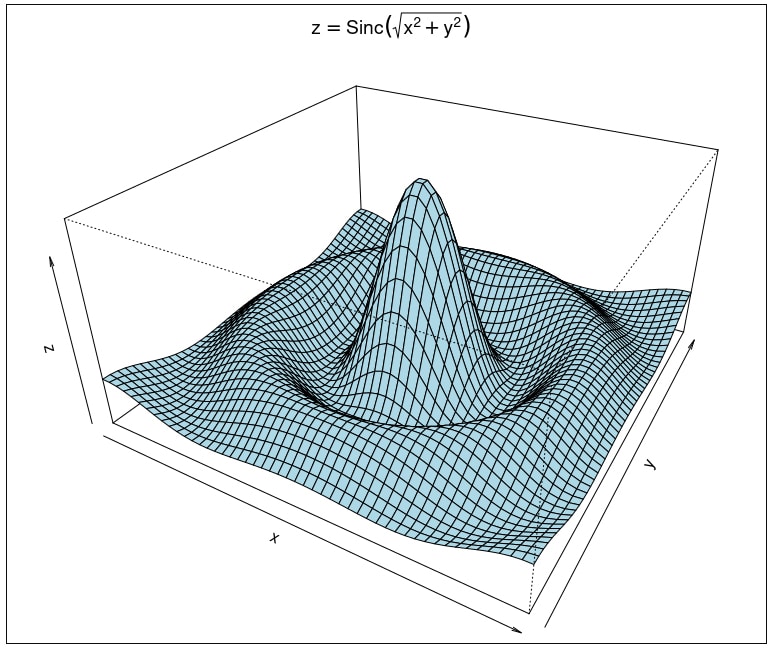
The following is an example of a rotated sinc function:
> demo(persp)
demo(persp)
---- ~~~~~
Type <Return> to start :
> ### Demos for persp() plots -- things not in example(persp)
> ### -------------------------
>
> require(datasets)
> require(grDevices); require(graphics)
> ## (1) The Obligatory Mathematical surface.
> ## Rotated sinc function.
It produces the graphical output shown in Figure 1.
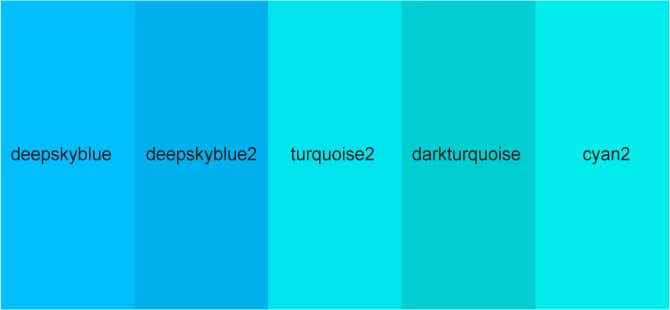
If you would like to see example code from R’s online documentation, you can use the ‘example’ function. For instance, different shades of blue can be seen from the colours example illustrated below:
> example(colors)
colors> cl <- colors()
colors> length(cl); cl[1:20]
[1] 657
[1] “white” “aliceblue” “antiquewhite” “antiquewhite1”
[5] “antiquewhite2” “antiquewhite3” “antiquewhite4” “aquamarine”
[9] “aquamarine1” “aquamarine2” “aquamarine3” “aquamarine4”
[13] “azure” “azure1” “azure2” “azure3”
[17] “azure4” “beige” “bisque” “bisque1”
colors> length(cl. <- colors(TRUE))
[1] 502
colors> ## only 502 of the 657 named ones
colors>
colors> ## ----------- Show all named colors and more:
colors> demo(“colors”)
demo(colors)
---- ~~~~~~
Type <Return> to start :
...
> plotCol(nearRcolor(“deepskyblue”, dist=50))
Hit <Return> to see next plot:
The image in Figure 2 is the output from the above example.
R has a number of built-in numeric functions. A few examples (square root, absolute value, floor, ceiling, truncate, cosine, exponent) with their respective outputs are shown below:
> sqrt(2)
[1] 1.414214
> abs(-3)
[1] 3
> floor(5.67)
[1] 5
> ceiling(5.67)
[1] 6
> trunc(4.32)
[1] 4
> cos(0)
[1] 1
> exp(1)
[1] 2.718282
There are also predefined functions (to upper case, to lower case, grep, string split) which operate on characters that you can use as follows:
> toupper(‘project’)
[1] “PROJECT”
> tolower(‘LOWER’)
[1] “lower”
> grep(‘l’, ‘lower’)
[1] 1
> grep(‘l’, ‘upper’)
integer(0)
> strsplit(“0,Item,Quantity,GST”, “,”)
[[1]]
[1] “0” “Item” “Quantity” “GST”
Since R is designed for statistical computing, there are also built-in statistical functions (sum, minimum, maximum, range, mean, median) available. A few examples are shown below:
> sum(1, 2, 3)
[1] 6
> min(1, 2, 3)
[1] 1
> max(1, 2, 3)
[1] 3
> range(1, 2, 3)
[1] 1 3
> x <- c(1, 2, 3)
> mean(x)
[1] 2
> median(x)
[1] 2
You can load a library into the R runtime environment using the library function. We will now import the Lattice library in R, which is useful for visualising data:
> library(lattice)
>
There also exists a ‘citation’ function that gives you information on how to cite R or its packages when mentioning it in publications. The output for the same is shown below for reference:
> citation()
To cite R in publications use:
R Core Team (2021). R: A language and environment for statistical
computing. R Foundation for Statistical Computing, Vienna, Austria.
URL https://www.R-project.org/.
A BibTeX entry for LaTeX users is
@Manual{,
title = {R: A Language and Environment for Statistical Computing},
author = {{R Core Team}},
organization = {R Foundation for Statistical Computing},
address = {Vienna, Austria},
year = {2021},
url = {https://www.R-project.org/},
}
We have invested a lot of time and effort in creating R, please cite it
when using it for data analysis. See also ‘citation(“pkgname”)’ for
citing R packages.
History
R is an alternate implementation of the S programming language. S is a statistical programming language created by John Chambers in 1976 at Bell Laboratories (previously AT&T). Rick Becker and Allan Wilks of Bell Laboratories have also worked on the initial releases of S. The S programming language is dynamically and strongly typed, and supports both the imperative and object-oriented styles of programming. Most of the S code actually runs without alterations on R.
In 1991, Ross Ihaka and Robert Gentleman at the University of Auckland, New Zealand, wrote an alternative implementation to the S programming language, which was promoted as the R programming language in 1993. The R project was officially released in 1995 as Free/Libre and Open Source Software (FOSS) and is now maintained by the R core team.
The ‘R Foundation for Statistical Computing’ or the ‘R Foundation’ was created by the R core team to facilitate the development of the R programming language, and its tools and ecosystem. It also offers support for all users, developers and organisations using R in the community and for commercial purposes. It is responsible for the copyright of the R software and documentation. The foundation also conducts meetings and conferences regularly, and its annual conference is called useR!.
In the next article in this series, we will go over the syntax and semantics of the R programming language.


