


To come up with an effective solution to a problem, you need to have the relevant insights into it. Distributed systems are prone to unexpected failures and malfunctions, and observability helps us find out the reasons for these in order to arrive at an effective solution.
Operating a distributed system is hard, not just because of its complexity, but also because of the unpredictability of failure modes. With quick software deliveries, continuous build deployments and modern cloud architectures, the possible failure modes are increasing. Unfortunately, traditional monitoring tools cannot help us to deal with these challenges anymore.
What caused these problems to begin with?
Tech giants like Amazon and Microsoft started building their applications with monolithic architecture as it was more convenient back in the day. They all had to go through the same challenges and hence chose microservices as a better solution, as these can be developed, scaled, and deployed independently. This significantly increased the delivery speed and scalability of applications, but on the flip side, they now have to deal with a different kind of operational complexity related to managing these microservices deployments. One of the benefits of working with older technologies was that only a limited set of failures occurred.
Using application programming interfaces (APIs) to expose core business functionality and facilitating service-to-service communication gives several control points, and makes it easier to build these complex modern applications. However, API-driven applications come with their own set of issues such as design complexity, lack of end-to-end visibility, and security concerns. We are going to discuss that in detail.
A peek into modern problems
Every company or organisation that is adapting to these microservices and API-based architectures is addressing these four basic questions:
- Are the services/APIs providing the functionality they were designed to deliver?
- Are the services/APIs secure?
- As a business do you understand the usage of APIs by users?
- Are the services/APIs providing the optimum performance to the user?
Visibility into dependencies
While addressing these questions, there are several problems that come up. Even as there are different solutions to these problems, there are simply too many gaps in them. There are several approaches to deal with and answer these questions. We can look into their dependencies. Microservices architecture, in general, is inherently very complex compared to the current distributed architecture that is being used. There is no end-to-end visibility into dependent services.
It is extremely important to understand the failure point. This is, in fact, the very first step of the debugging process because whenever something breaks we can only fix it if we have a good understanding of what is broken. It is difficult to decipher the connected metrics between services. So, in general, the visibility aspect is essential to this modern and complex architecture.
In order to find the problem areas, you need to correlate the multiple dashboards that are being used. Most developers are often trying to figure out this correlation between different services and metrics manually, which also increases the cognitive load on the development.
The role of logs
The metrics will tell you what broke, and the logs will tell you why it broke in the first place. The first logical step after looking at your metrics is to go to logs and understand why the failure happened that led everything to behave abnormally. Query logs by requestID result in a huge number of logs in the microservices world. This is because if you have one call that is touching 1000 different services, then you have to deal with a huge pile of the log. And sequential navigation through logs to find out the root cause is hard. It is also hard to correlate due to the sheer amount of logs present.
Debugging slow queries
Sometimes your customer data does not load properly and your customers are unable to log in because the database having their data is slow. To deal with this, the traditional way is to manually log slow queries into the logging system. This also leads to an increased dependency on DBAs to get slow query logs.
Why we need observability
“Monitoring tells you whether a system is working; observability lets you ask why it isn’t working”
— Baron Schwartz
All questions about visibility, service interactions and slow queries can be answered by observability. In control theory, observability is defined as a measure of how well the internal states of a system can be inferred from the knowledge of that system’s external outputs. Simply put, observability is how well you can understand your complex system.
| Need for observability |
|
Ability to answer abstract questions
If we are placing an order on Amazon and something goes wrong, then what characteristics did the queries that timed out at 500ms common — service versions, browser plugins?
Instrumentation produces data and querying the data answers this question. You may be wondering what this instrumentation data is. Well, there are three data sources that we are talking about here — metrics, logs and distributed tracing.
Metrics are basically the aggregated summary statistics. These are valuable because your operating system and applications generate metrics that are going to contain a name or a time stamp and a field that represents some value. They are the first obvious place to start with when it comes to monitoring. One issue that metrics present are that they lack context. You can see something weird going on with your system but you will never know what, unless you look into the second pillar — logs.
Logs contain detailed debugging information emitted by processes. They play perhaps the second most important role in your toolbox because they tend to give us more in-depth information about resources than metrics. So, if metrics show us that a resource has died, logs will let us know why it died in the first place. The problem with logs is that they are hard to correlate and bring into context. This brings us to our next pillar — distributed tracing.
Distributed tracing provides insights into the full life cycle, aka traces of requests to a system, allowing you to pinpoint failure and performance issues. It adds critical visibility into the end-to-end health of the application. For instance, whenever a request comes to the front-end, a unique ID is assigned to it and that request gets tracked throughout the system. Along the way, we collect telemetry data, which can be shown in different formats.
| Visibility into dependent services The old way: Whenever something broke, say, you found out that service X had some latency issues, you had it checked with the service owner to understand dependencies. Then you also looked at metrics that were exported to Prometheus manually.The new way: In the new way, the dependency graph is already created with real-time metrics based on the available data.Finding hotspots The old way: Multiple dashboards were required to correlate. The new way: Complete request is visualised in a single pane.Log fatigue The old way: You had to query logs by requestID and dig through all the logs generated across all the services for this request. The number of log lines also increased based on the number of dependencies.The new way: You just figure out the problematic span and find correlated logs in the same view. If a particular span is taking more time than was accounted for, then you can click on it and see correlated logs in the context.Debugging slow queries The old way: There was a dependency on DBAs to get slow query logs. You had to manually log slow queries into the logging platform and create dashboards. The new way: ‘Automagic’ creation of query dashboards can be done today. |
What is Hypertrace?
Hypertrace is an open source distributed tracing and observability platform that helps to make sense of the production request. It converts data into relevant insights for everyone. It helps the infrastructure team to identify which services are causing overload, allows the application team to understand which requests put their service objectives at risk, and lets the deployment team find the problems.
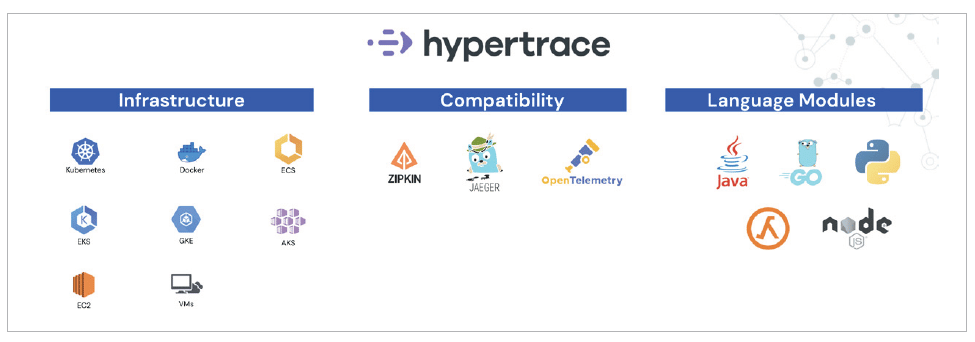
| Hypertrace deployment |
| From the infrastructure end of things you can easily deploy Hypertrace on any of the container environments like Kubernetes, EKS, ECS, AKS, VMs, GKE or Docker. It is compatible with Zipkin, OpenTelemetry and Jaeger. Language modules such as Java, Python and Go are also supported (refer to Figure 1). |
Why should you choose Hypertrace?
From extensibility and interoperability to extremely effective logs and alerts, Hypertrace has several features that make it a good choice for observability. Here is a quick look at some of the key features of this platform.
- Topology: Hypertrace lets you view the topology of all services and backends in real-time. It is scalable for hundreds of them.
- Dashboards: It provides you pre-scanned dashboards for services, APIs, and backends.
- Extensibility: You can write your own enrichers to enrich trace data for your business needs and create a view around them.
- Interoperability: Hypertrace works out-of-the-box with all open source tracing formats like Zipkin, OTel and Jaeger.
- GraphQL APIs: It traces, spans, and exposes entities through GraphQL APIs. It helps build the next creative use case.
- API and trace analytics: It helps to slice and dice all data powered by Apache Pinot.
- Span logs: Hypertrace speeds up root cause analysis (RCA) and reduces mean time to detect (MTTD) with span logs on the platform.
- Error analytics: It lets you find issues quickly with error highlighting and filters.
- Alerting: You get an alert on any deviation/anomalies in the out-of-bag (OOB) metrics.
A host of such desirable features makes Hypertrace a great cloud-native distributed tracing based tool for observability. It is evolving tremendously as people are continuously contributing towards it. Definitely something to check out!
Transcribed and curated by Laveesh Kocher


