


The KNIME (Konstanz Information Miner) analytics platform is perhaps the strongest and most comprehensive free platform for drag-and-drop analytics, machine learning, statistics, and ETL (extract, transform and load) models. This article will help develop a supervised machine learning decision tree algorithm through the KNIME tool for a car evaluation data set.
Data science, data pre-processing, modelling, analysis, and visualisation are all enabled within K, NIMEthe Konstanz Information Miner. The workflows can run both through the interactive interface and also in batch mode in this free and open source software. These two setups allow for easy local job management and regular process execution. KNIME integrates various components for machine learning and data mining through its modular data pipelining ‘Lego of Analytics’ concept.
 Let’s develop a supervised machine learning decision tree algorithm through the KNIME tool for the car evaluation data set. Decision trees are created for the car model based on the technical features, pricing criteria (overall cost, maintenance cost), comfort, size of luggage boot, safety, etc. The decision tree learner node and the predictor nodes are connected with both trained data and test data for training and evaluating the model with better output. Then the decision tree predictor is configured with the scorer node to generate the required evaluation performance metrics and to report data for user interface visualisation.
Data science, data pre-processing, modelling, analysis, and visualisation are all enabled within KNIME, the Konstanz Information Miner. The workflows can run both through the interactive interface and also in batch mode in this free and open source software. These two setups allow for easy local job management and regular process execution. KNIME integrates various components for machine learning and data mining through its modular data pipelining ‘Lego of Analytics’ concept.
Let’s develop a supervised machine learning decision tree algorithm through the KNIME tool for the car evaluation data set. Decision trees are created for the car model based on the technical features, pricing criteria (overall cost, maintenance cost), comfort, size of luggage boot, safety, etc. The decision tree learner node and the predictor nodes are connected with both trained data and test data for training and evaluating the model with better output. Then the decision tree predictor is configured with the scorer node to generate the required evaluation performance metrics and to report data for user interface visualisation.
To install KNIME:
- Download the KNIME Desktop Application from https://www.knime.com/.
- Install this application and provide the necessary permissions during the setup process.
Decision tree
A decision tree is a decision support tool that uses a tree-like model of decisions and their possible consequences, including chance event outcomes, resource costs, and utility. It is one way to construct a model that contains conditional control statements. Decision trees are used for handling non-linear data sets effectively. The decision tree tool is used in real life in many areas, such as engineering, civil planning, law, and business.
Designing a supervised ML car evaluation decision tree model
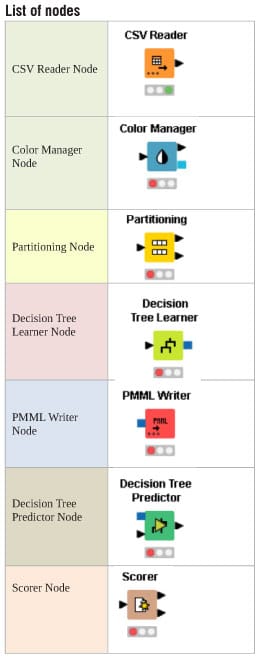
First, create a new workflow for the car evaluation model. Drag the .csv file into KNIME to create and initialise the CSV Reader node. Connect it to a colour manager, where each genre can be assigned a specific colour under ‘swatches’ or a preset under ‘palettes’.
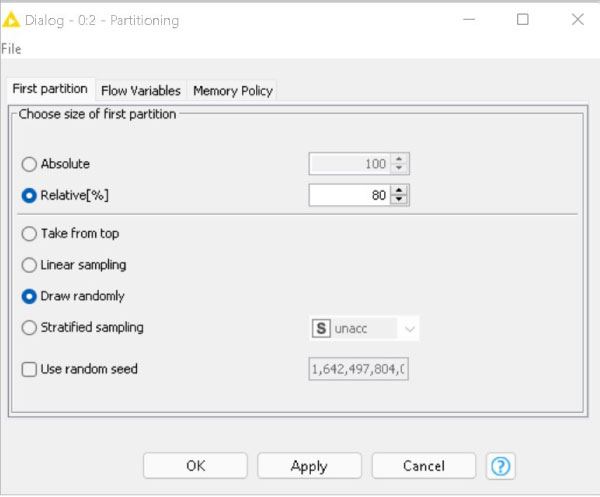
Next, connect the colour manager to the partitioning node. This is used to separate the given data set into two partitions — one consisting of 80 per cent of the data and the other consisting of the remaining 20 per cent of the data. Thus the data is partitioned into two sets for testing and training in an 80:20 ratio. This partition is done by choosing the ‘randomly’ option.
Now we need to connect the partitioning node to the decision tree learner. Configure it as a class column as units, and change the records as per the required analysis. Next, connect the decision tree learner to the decision tree predictor. Send the smaller partition (test data) to the decision tree learner in order to classify the values, which can then be predicted by the decision tree predictor.
Finally, send the output to the scorer node to measure the performance metric score. Compile and execute all the nodes at each stage of connection to get proper outputs.
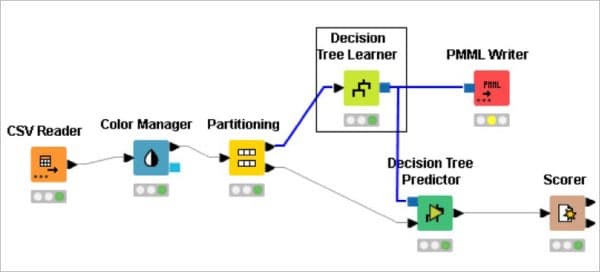
Now, for viewing the output as a report, connect it to the PMML (predictive model markup language) writer node. Figure 1 shows the KNIME workflow.
Node configurations
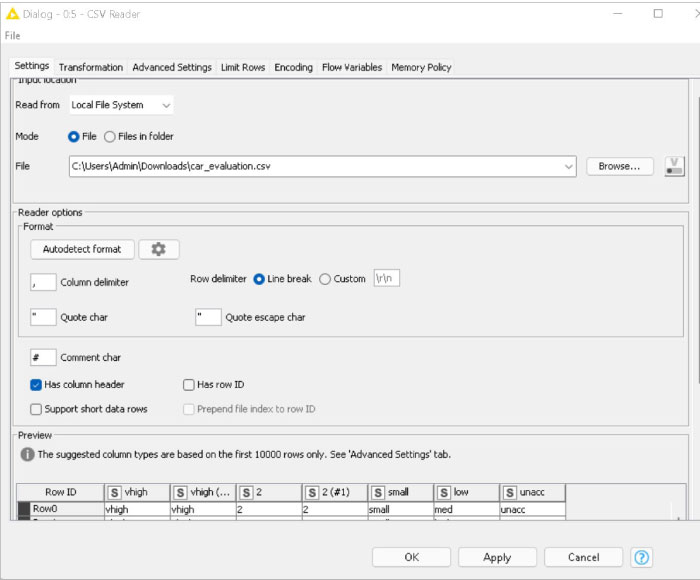
The CSV reader node reads CSV files (Figure 2). Use this node if the workflow is created in a server or batch environment, and when the input files structure changes between different invocations. The car evaluation data set is loaded using the CSV reader node.
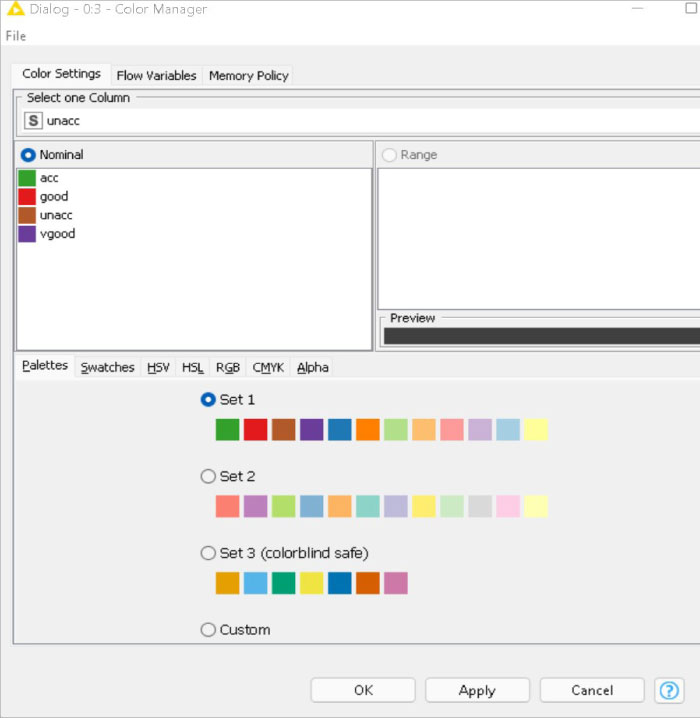
Colours can be assigned for either nominal (possible values have to be available) or numeric columns (with lower and upper bounds). If these bounds are not available, a ‘?’ is provided as a minimum and maximum value. The values are then computed during execution. If a column attribute is selected, the colour can be changed with the colour chooser (Figure 3).
The input table is split into two partitions (i.e., row-wise), e.g., train and test data. In this case, 80 per cent of the data is used for training and 20 per cent for testing (Figure 4).
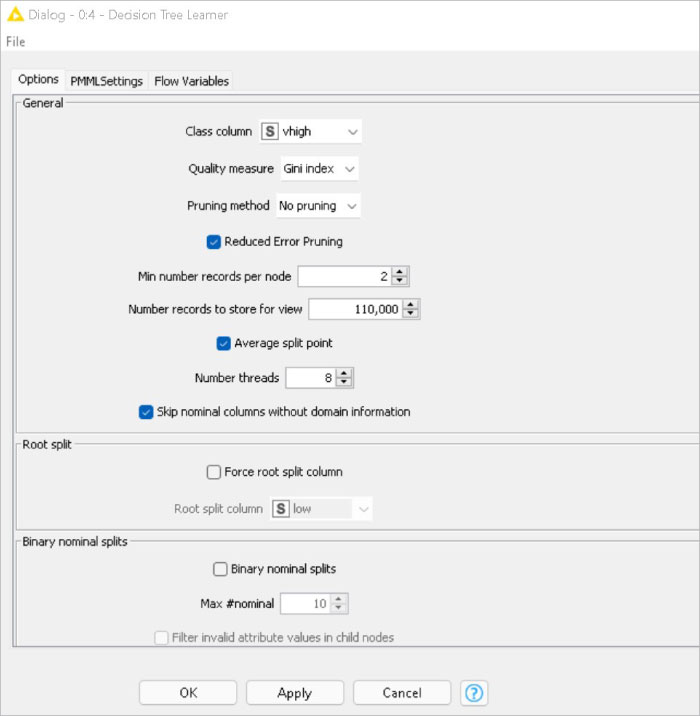
The decision tree learner node induces a classification decision tree in the main memory (Figure 5). The target attribute must be nominal. The other attributes used for decision-making can be either nominal or numerical. Numeric splits are always binary (two outcomes), dividing the domain into two partitions at a given split point. Here the target variable is ‘Evaluation’.
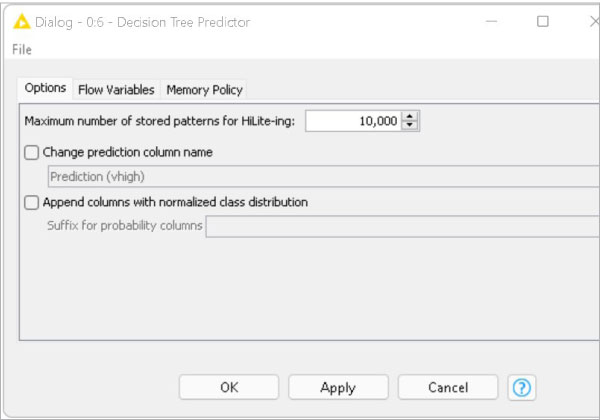
The decision tree predictor node uses an existing decision tree (passed in through the model port) to predict the class value for new patterns (Figure 6).
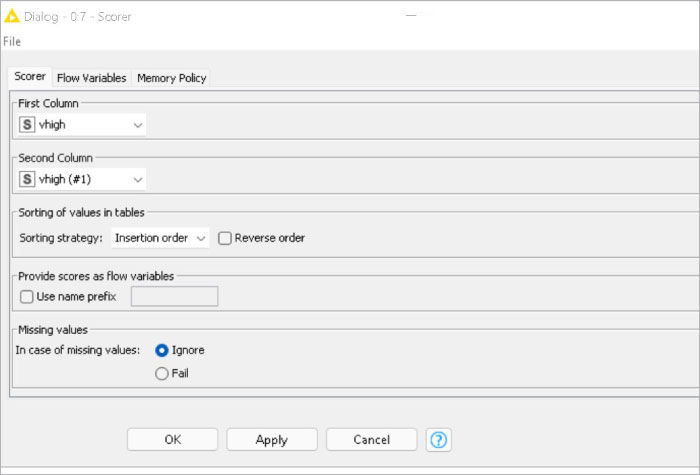
The scorer node compares two columns by their attribute-value pairs and shows the confusion matrix, i.e., how many rows of which attribute and their classification match (Figure 7). Additionally, it is possible to highlight cells of this matrix to determine the underlying rows. Here, the accuracy achieved is 95.6 per cent.
Visualisation output
Figure 8 demonstrates the decision tree output of the car evaluation model, which visualises the learned decision tree. Based on the selections, the tree can be expanded and collapsed with the plus/minus signs.
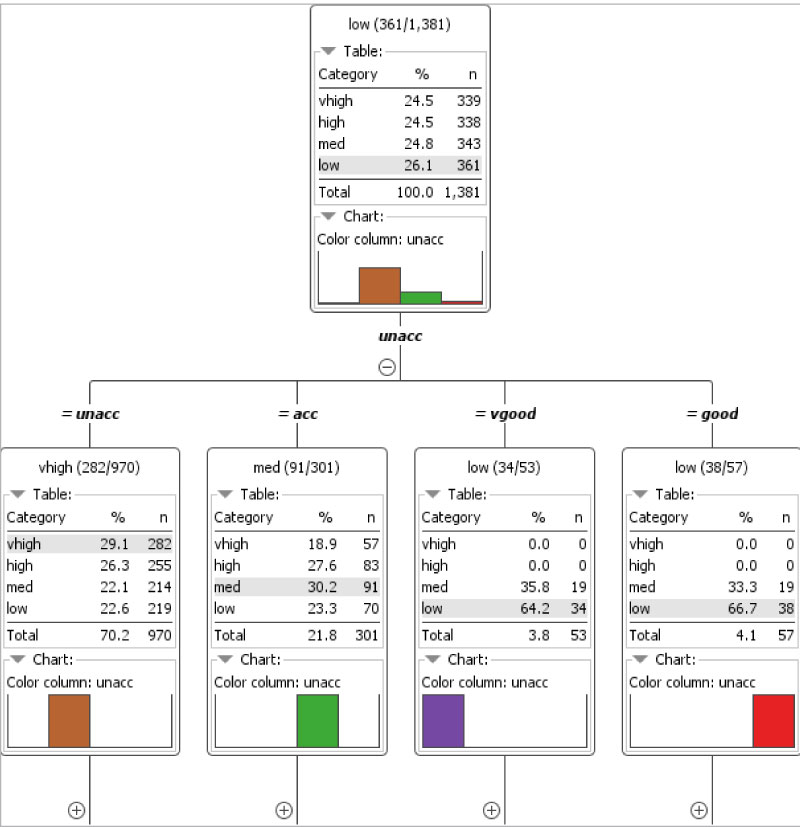
As with the splitting criteria, the attribute name of the parent node is split, and its numeric value and nominal set value are represented to this child. The value in round brackets states (x of y), where x is the quantity of the majority class and y is the total count of examples in this model.

Figure 9 represents the visualisation report of the car evaluation model. The PMML node is used to transmit models between nodes. PMML ensembles models, through reader and writer nodes, for importing and exporting these with other software.


