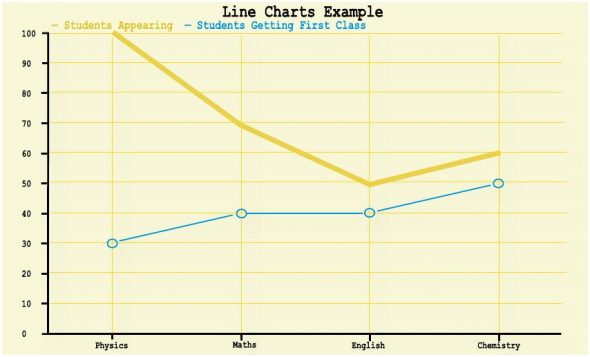
In the earlier parts of this series, we looked at using Open Flash Charts (OFC) to create great-looking bar charts and pie charts. In this part, let us look at how to create line charts and draw multiple line charts in the same graph, which shows even more data in a very effective manner.
As always, let us first define our data for the graph. For our line chart, let us take a classroom scenario. For each subject, we have the total number of students that appeared, and the number of students that get a first class, as shown in the table below. Let us plot this data as multiple line charts — one line showing the total number of students and the second the number of students getting a first class.
| Subject | Total no. of students | Total no. with first class |
| Physics | 100 | 30 |
| Mathematics | 70 | 40 |
| English | 50 | 40 |
| Chemistry | 60 | 50 |
Get going
I assume that the data is already stored in a MySQL database, and will proceed straight to the data file (with the SQL query to fetch data to be plotted, you can proceed to format it and pass it on to OFC to render the graph). The data file to draw the line chart for our example is as follows:
<?php
$die = false;
$link = @mysql_connect('localhost','test_user', 'test_pwd') or ($die = true);
if($die)
{
    echo '<h3>Database connection error!!!</h3>';
    echo 'A connection to the Database could not be established.<br />';
    echo 'Please check your username, password,database name and host.<br />';
    echo 'Also make sure <i>mysql.class.php</i> is rightly configured!<br /><br />';
}
mysql_select_db('test_database');
include_once 'php-ofc-library/open-flash-chart.php';
$query = mysql_query('SELECT DISTINCT Subject, Total_Students, Total_First_Class Number FROM  test_linechart');
While($queryRow = mysql_fetch_array($query,MYSQL_ASSOC))
{
    $labels[] = $queryRow['Subject'];
    $data_1[] = intval($queryRow['Total_Students']);
    $data_2[] = intval($queryRow['Number']);
}

$default_dot = new dot();
$default_dot->size(5)->colour('#DFC329');

$line_dot = new line();
$line_dot->set_default_dot_style($default_dot);
$line_dot->set_width( 4 );
$line_dot->set_colour( '#DFC329' );
$line_dot->set_values( $data_1 );
$line_dot->set_key( "Students Appearing", 10 );

$default_hollow_dot = new hollow_dot();
$default_hollow_dot->size(5)->colour('#6363AC');

$line_hollow = new line();
$line_hollow->set_default_dot_style($default_hollow_dot);
$line_hollow->set_width( 1 );
$line_hollow->set_colour( '#6363AC' );
$line_hollow->set_values( $data_2 );
$line_hollow->set_key( "Students Getting First Class", 10 );

$y = new y_axis();
$y->set_range( 0, 100, 10 );

$x_label = new x_axis_labels();
$x_label->set_labels($labels);

$x = new x_axis();
$x->set_labels($x_label);

$chart = new open_flash_chart();
$chart->set_title( new title( 'Line Charts Example' ) );
$chart->set_y_axis( $y );
$chart->set_x_axis( $x );
//
// here we add our data sets to the chart:
//
$chart->add_element( $line_dot );
$chart->add_element( $line_hollow );

echo $chart->toPrettyString();
?>
In the above code, first connect to the database, and fire the query to fetch all rows in the table. The result set is saved in three different arrays; the first array has the ‘Subjects’, which is used to create the x axis label. The second and the third arrays save the data to be plotted.
Then get down to plot the data. First a dot object is created, and the size and colour defined. Then a new line object is created; the dot object is passed as dot style to the line. Then the width and colour of the line are set. Finally, set the data to be plotted, by passing the array containing the data to the set_values method. The key is set using the set_key method. Similarly, the next line object is created and the data to be plotted is passed to it.
Then the x axis and y axis objects are created. For y axis, the range is set as 0-100, with an interval of 10. For x axis, the labels are created by passing the labels array we have already saved.
Finally, the chart object is created, and the x and y axes are set, and the line objects are passed as elements to the chart. This completes the data file. Save the above code as data_file.php in the Web server root folder. Next, start with the HTML file to be used, which is as follows:
<html>
<head>
    <title></title>
<script type="text/javascript" src="js/swfobject.js"></script>
<script type="text/javascript">

swfobject.embedSWF(
  "open-flash-chart.swf", "line_chart",
  "500", "500", "9.0.0", "expressInstall.swf",
  {"data-file":" data_file.php "} );
</script>
</head>

<body>
 <div id=line_chart">
</div>
</body>
</html>
In this HTML file, include the data file, data_file.php. The size of the graph to be plotted can be passed as arguments; here, 500×500 pixels. Next, add the div ‘line_chart’, which is specified in the header as where to embed the Flash object. Save this file as line_display.html in the Web server root folder.
That’s it!

When accessed through the browser, you can see the graph in action, as in Figure 1, which is a screenshot of the created graph. I hope you liked the article, and that it helps you in your work. Any queries or suggestions are most welcome.


Nice Tutorial