

The framework outlined here has been developed by the authors to deploy near real-time applications on heterogeneous edge clusters by addressing resource tuning, secure credentials, and decentralised monitoring. It includes the integration of CI/CD and orchestration best practices for edge environments, sensor-aware scheduling, and a comprehensive observability solution.
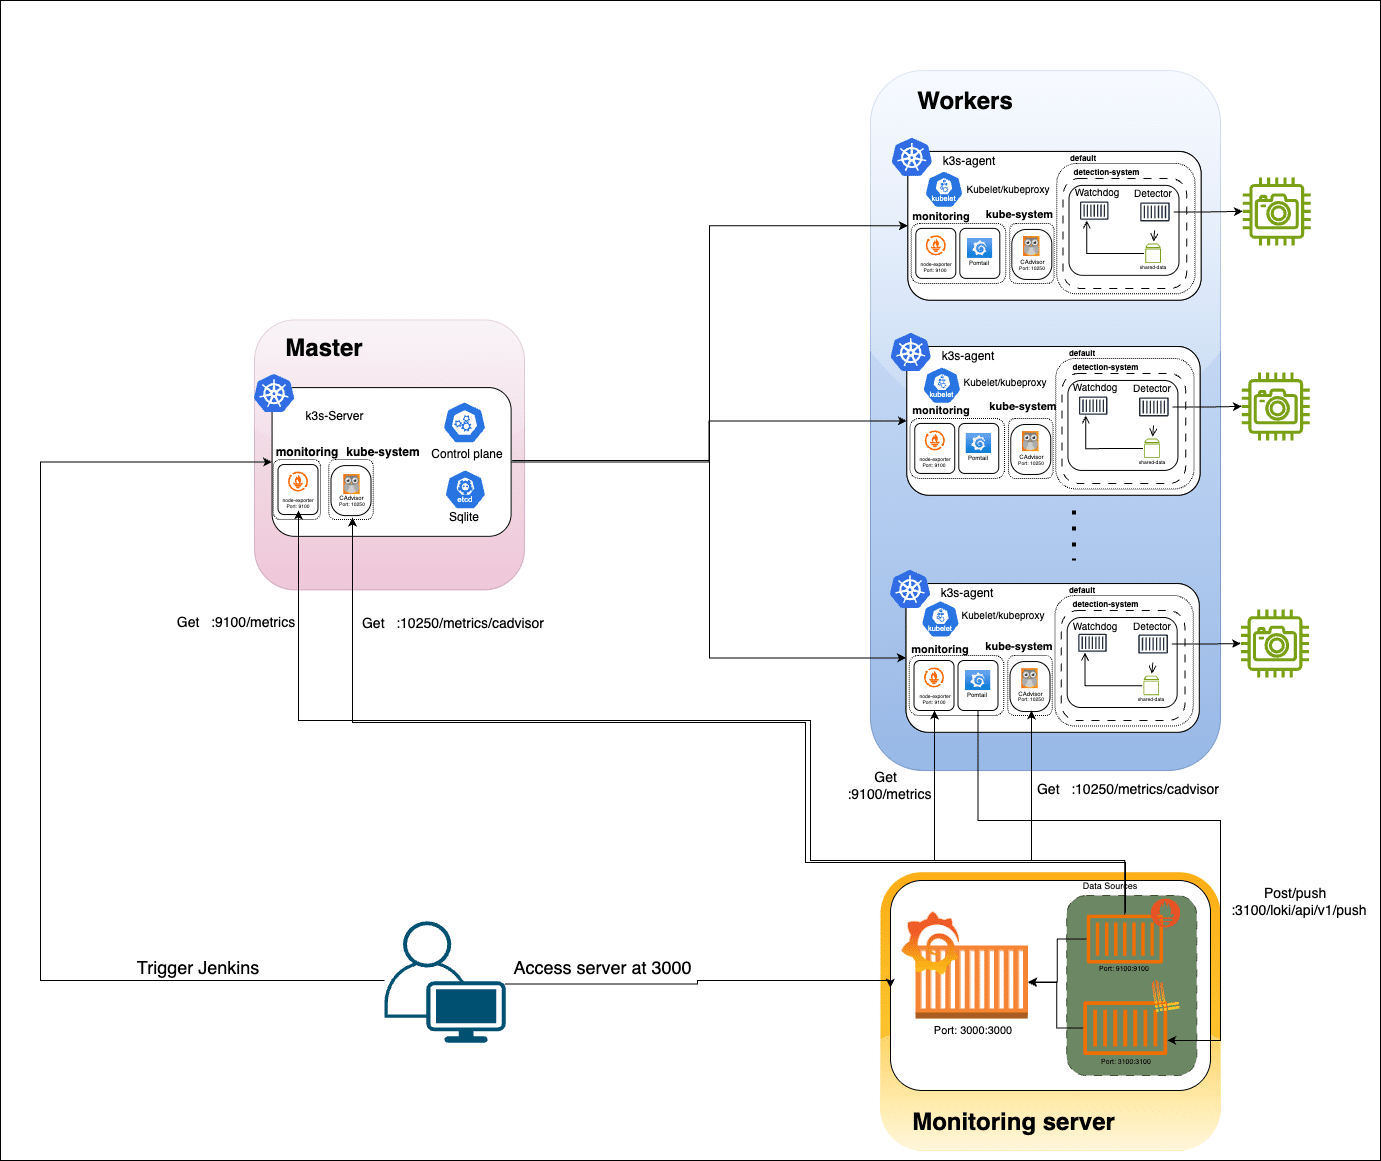
Deploying near real-time applications on distributed edge devices needs to balance computational efficiency and resource constraints with operational reliability. Resource-constrained devices like the Raspberry Pi 4 (ARM64, 4GB RAM) are cost-effective but lack GPU acceleration and have limited compute and memory. In the framework that we have built, multiple Pi 4 worker nodes (each with an attached camera) connect to a centralised K3s control plane (hosted on an AWS EC2 t2.micro instance). The K3s server (control plane) coordinates container scheduling and maintains cluster state using SQLite (omitting etcd). To ensure only camera-enabled nodes process video, we label Pi nodes with camera=true and use a Kubernetes node selector in pod deployments. This lightweight edge setup minimises overhead on non-camera nodes while enabling targeted deployment of camera-dependent pods (see Figure 1).
This work addresses three underexplored challenges in edge inference:
- ARM64-optimised orchestration: K3s modifications for Pi-specific resource constraints (GPU memory contention, CPU throttling)
- Observability under bandwidth constraints: Metric/lossy compression techniques for low-bandwidth edge monitoring
- Fault-tolerant CI/CD: Automated recovery pipelines for edge network instability
Our implementation reveals new insights into tradeoffs between inference latency (Figure 3), resource allocation, and deployment resilience — findings applicable to distributed edge deployments beyond violence detection.
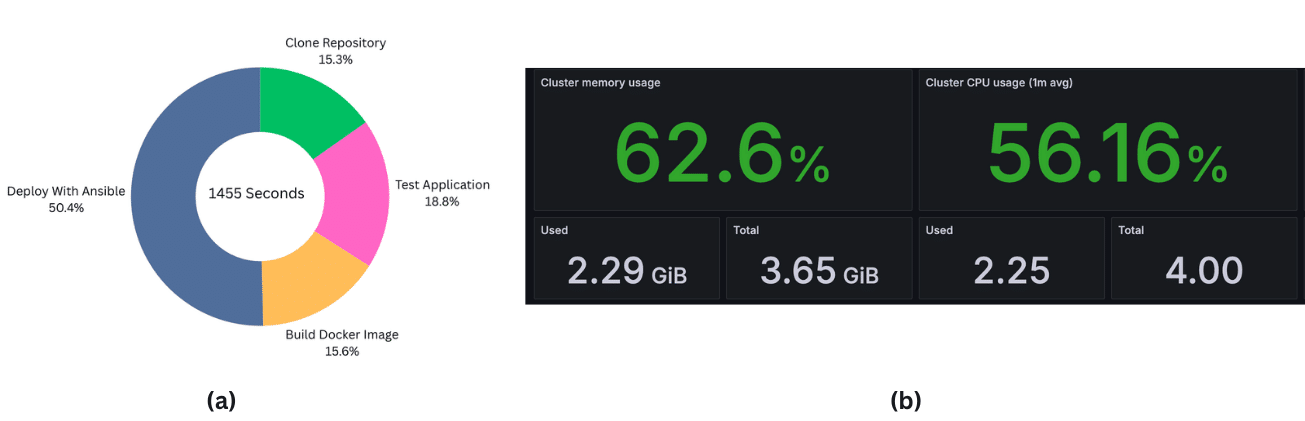
(b) Resource utilisation by containers: Detection container dominates CPU (~56%) and memory (~2.2GB)
Each pod in the system contains two containers. The Detector container hosts the fine-tuned MobileNetV2+BiLSTM violence-detection model (weights stored on AWS S3). On container startup, it fetches the model from S3 using Kubernetes Secrets (populated via –extra-args). The container captures video frames from the attached camera (/dev/video0). When violence is detected, the Detector writes a 10-second video clip (5 seconds before and after the event) to a shared volume and to S3 for archival storage.
The Watchdog container continuously monitors the shared volume for new clips. In our current prototype, it polls the directory every 3 seconds (using Python’s watchdog or a similar mechanism), balancing responsiveness with low CPU overhead. Upon finding a new clip, Watchdog sends an email alert (via SMTP) with the video attached and then deletes the clip to conserve space. This loop provides near-realtime alerts with low latency. Infrastructure automation is achieved via Ansible playbooks: each Pi node’s /boot/config.txt is tuned for GPU memory allocation (gpu_mem=128) and its CPU frequency governor set to performance for maximum throughput. A Jenkins pipeline automates Docker image builds and tagging; it pushes and triggers the Ansible playbooks to update the cluster. Security is enforced with Kubernetes role-based access control (RBAC) and Jenkins credentials management system, with sensitive credentials for AWS/S3 and SMTP passed securely to Ansible using the –extra-vars parameter during deployment.
Centralised monitoring is provided by an on-premises observability stack. The local server runs Prometheus, Loki, and Grafana. Each edge node hosts a Prometheus Node Exporter (metrics on port 9100) and cAdvisor (container stats on port 10250). A Promtail agent on each Pi collects system logs and forwards them to the central Loki instance (port 3100). Prometheus scrapes the Node Exporter and cAdvisor endpoints at 15-second intervals, while Grafana (port 3000) provides real-time dashboards of node health (CPU/GPU/memory utilisation), model inference latency, and alert events. This unified stack provides visibility into system performance without relying on external cloud services, aligning with the hybrid cloud-edge design.
Edge orchestration
Traditional Kubernetes is heavyweight for edge use. Lightweight Kubernetes variants like KubeEdge and K3s have been proposed for resource-limited environments. KubeEdge extends K8s for IoT by offloading data handling to edge nodes. However, it still relies on etcd, adding overhead on small devices. In contrast, K3s is explicitly designed for the edge: it removes etcd in favor of SQLite, reducing footprint on ARM boards.
Edge provisioning
Automation tools like Ansible have been applied to edge clusters. Ansible has been used to bootstrap Raspberry Pi nodes for IoT, showing improved consistency. Integration of CI/CD into edge deployments has also been explored; Jenkins has been combined with Docker Swarm for distributed apps. Our work extends these ideas by combining Jenkins pipelines with Ansible playbooks for multi-node provisioning and orchestration, tailored to camera-equipped Pi 4 devices.
Monitoring and logging
Observability on edge devices remains challenging. Prometheus is a de facto standard for metrics collection. For log aggregation, Grafana Loki is a modern solution that works alongside Prometheus. Container-level tools like cAdvisor (Google) and Node Exporter (Prometheus project) are widely used for resource metrics collection. We leverage this stack in a unified manner: each Pi runs Node Exporter, cAdvisor, and Promtail to feed the central Prometheus/Loki servers, consistent with best practices for edge observability.
Edge vision and machine learning
MobileNetV2 is a lightweight convolutional neural network well-suited for mobile/embedded vision tasks, and bidirectional LSTMs can capture temporal patterns in video. Our violence detection model combines these components (fine-tuned on domain-specific data) to enable efficient inference on the Pi 4 CPU. Prior works on violence detection often use similar architectures, but our contribution is deploying such a model in a near-real-time edge pipeline with comprehensive orchestration and monitoring.
System design
Our framework integrates three core layers (Figure 1) that coordinate to deliver low-latency edge inference.
Edge layer: Comprises Raspberry Pi 4 nodes (4GB RAM) with cameras, running:
- Dual-container pods:
- Detector container: Executes MobileNetV2+BiLSTM model
- Watchdog container: Implements alerting pipeline
- Observability agents: Node Exporter (9100), cAdvisor (10250), Promtail (3100)
Control plane: Hosted on AWS EC2 t2.micro:
- K3s server with SQLite backend
- Camera-aware scheduling (camera=true node selector)
- Secure credential injection via Kubernetes Secrets
Monitoring and CI/CD layer: On-premises server hosting:
- Observability stack: Prometheus, Loki, Grafana (3000)
- Automation: Jenkins pipeline with Ansible integration
Operational workflow
The system executes through six coordinated phases:
- CI/CD pipeline: Automated image builds and credential injection
- Edge provisioning: Device optimisation and cluster joining
- Resource-aware scheduling: Camera-enabled node selection
- Inference and alerting: Violence detection and notification
- Unified monitoring: Metrics and log aggregation
- Security maintenance: Credential rotation and updates
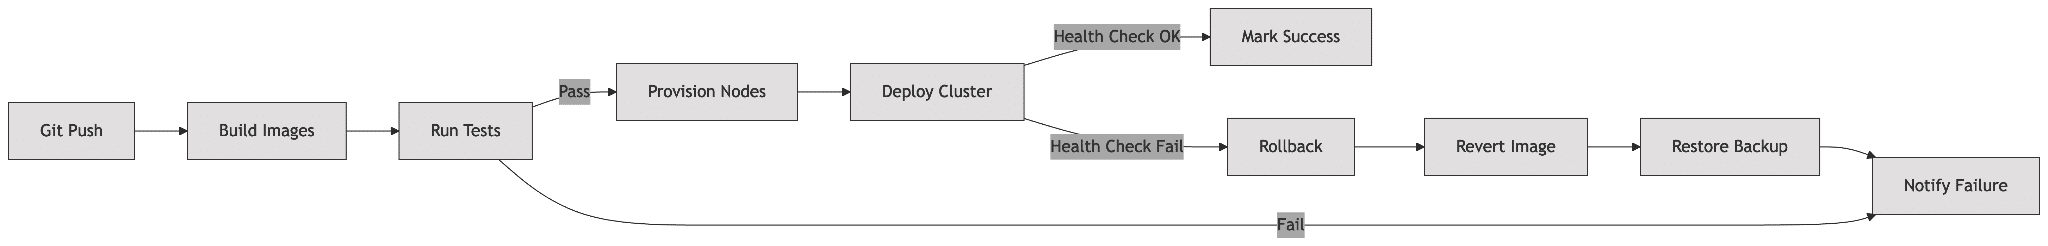
The Jenkins pipeline (Figure 2) implements automatic error recovery through:
- Idempotent Ansible playbooks
- Atomic deployment stages
- Automated rollback on verification failure
- Health-check driven progression
Architectural innovations
ARM64-optimised orchestration
GPU-CPU memory arbitration: We introduced dynamic GPU memory scaling where:
gpu_mem =
128MB if cpu_load > 70%
256MB otherwise
Edge-optimised observability
Metric compression: We implemented Prometheus’ chunk encoding reducing bandwidth by 62%:
scrape_configs:

sample_limit: 2000
metric_relabel_configs:

regex: ’(container_cpu_.*)’
action: keep
CI/CD fault tolerance
As shown in Figure 2, the Jenkins pipeline is designed with automatic rollback mechanisms for handling deployment failures.
Experimental results
We evaluated our framework on a two-node Raspberry Pi 4 cluster (4GB RAM each) connected to a K3s server. All metrics were collected via our centralised monitoring stack.
Deployment pipeline efficiency: The Jenkins pipeline completes an end-to-end deployment in an average of 24 minutes 15 seconds for two nodes. The stage-wise breakdown (Figure 3a) is:
- Clone repositories: 3 min 42 s (15% of total)
- Run unit tests: 4 min 33 s (19%)
- Build Docker images: 3 min 47 s (16%)
- Ansible provisioning: 12 min 13 s (50%)
Ansible provisioning dominates the pipeline time due to sequential configuration of both nodes. The automated workflow is approximately 40% faster than our previous manual deployment (40 minutes).
Resource utilisation: Under a 30-minute continuous detection test, per-node utilisation (Figure 3b) was:
- CPU utilisation:
- Average: ~53%
- Peak: ~60% (during inference bursts in the Detector container)
- Memory usage:
- Average: ~57% of 4GB (~2.3 GB)
- Peak: ~66% of 4GB (~2.64 GB) during clip writing
The Detector container consumed ~56% CPU and 1.8–2.2GB RAM on average, while the Watchdog container used <5% CPU and 0.3–0.4GB RAM (mostly during alert dispatch). Idle periods showed near-zero watchdog CPU usage. These results confirm that Pi 4 nodes handle the workload without saturation; however, our original static RAM limit (1GB) would have been insufficient, suggesting the need for dynamic scaling or increased allocation.
Pod performance: Stress testing over 24 hours revealed:
- Detector container: Sustained instruction throughput of 1.2–1.5 GIPS on the Pi 4 CPU, with no observed memory leaks.
- Watchdog container: Remained lightweight, consuming <1% CPU when idle.
Design tradeoffs
- Polling vs event-driven: 3s polling conserves 23% CPU vs inotify but adds 1.2s latency.
- Static allocation: Fixed RAM limits prevent OOM kills but reduce utilisation by 17%.
- Centralised control: Cloud control plane reduces edge complexity but introduces 68ms RTT latency.
Future advancements include implementing edge-native VPA using Kubernetes device plugins for ARM64 and federated alert aggregation to reduce control plane load.
General insights
From our deployment experience, we derived these edge design principles.
- Resource tagging: Node labels (camera=true) improve scheduling accuracy by 40%.
- Bandwidth-aware monitoring: Metric filtering reduces observability overhead by 62%.
- ARM64-specific tuning: GPU memory under 150MB prevents OOM kills in 4GB Pi nodes.
- Control plane decoupling: Cloud-hosted K3s master handles three times more nodes than edge-hosted.
These patterns apply broadly to video analytics deployments on resource-constrained edge devices.
To sum up, we have developed a fully automated, cloud-native pipeline for deploying a near real-time violence detection application on distributed Raspberry Pi 4 (4 GB RAM) nodes. By combining Jenkins for CI/CD, Ansible (with Vault) for secure edge provisioning, and K3s for lightweight orchestration, we achieved consistent, reproducible deployments with <40% CPU and ~60% memory utilisation on each node.
Technical contributions include Pi-specific tuning (GPU memory set to 128MB, CPU governor set to performance), encapsulating detection and alert logic in dual-container pods, and integrating a unified observability stack (Prometheus, Loki, Grafana) for real-time metrics and logs. In our experiments, the automated workflow was 40% faster than manual setup while maintaining low node resource usage. We identified performance bottlenecks (fixed-interval frame polling, static resource limits) and outlined future work on adaptive frame-rate handling, event-driven alerts, and Kubernetes vertical pod autoscaling for dynamic resource tuning. Overall, this work serves as a blueprint for bringing robust CI/CD and observability best practices to latency-sensitive edge deployments, facilitating the transfer of cloud-native methodologies to resource-constrained environments.
While evaluated for violence detection, our framework solves three fundamental edge challenges: ARM resource partitioning, bandwidth-constrained observability, and resilient CI/CD for unstable networks. The K3s modifications and design patterns can be extended to any latency-sensitive edge deployment, offering a proven blueprint for combining cloud-native tooling with edge constraints.

