In the past two issues, we have simulated two wired networks using ns-3. But the world is moving on from wired communication to wireless communication very quickly. The drop in the number of landline telephone connections over the years, summarises the sad story of wired communication. Industry and academia are eagerly waiting for results impacting the wireless communication sector. So it is time for us to move on to simulating wireless networks.

Simulating wireless networks with ns-3
In this section, we will simulate a simple network involving wired and wireless nodes. This is another area where ns-3 clearly outperforms ns-2. In the latters case, simulating a wired-cum-wireless network is not an easy task. We have to use hierarchical addressing to simulate wired-cum-wireless networks in ns-2. Packet movement in the wireless section of a wired-cum-wireless network is not visible in the NAM animator of ns-2. But in ns-3, we dont have any such problems. We can simulate a pure wireless network involving wireless nodes alone or we can simulate a network involving both wired and wireless nodes. The ns-3 script called wireless.cc , which is discussed in this section, will generate an animation trace file called wireless.xml and an ASCII trace file called wireless.tr. I have only discussed the code relevant to wireless communication in this article but you can download the complete wireless.cc file and all the others mentioned in this article from opensourceforu.com/article_source_code/September2015/ns3.zip.
The following lines of code show the additional header files required for simulating wireless networks. These header files are included in addition to the header files we discussed in the previous example of scripts involving wired networks.
#include ns3/wifi-module.h #include ns3/mobility-module.h #include ns3/internet-module.h
The following lines of code create an object allNodes of class NodeContainer common to all the other nodes and add two Wi-Fi station nodes to the allNodes object. The NodeContainer class keeps track of all the node pointers.
NodeContainer allNodes;
NodeContainer wifiStaNodes;
wifiStaNodes.Create(2);
allNodes.Add(wifiStaNodes);
The next three lines of code create a Wi-Fi access point (AP) node, which allows wireless devices to connect to a wired network. Since we also have a wired section in this network, a Wi-Fi AP node is mandatory. This Wi-Fi AP node is also added to the common node container object allNodes, as follows.
NodeContainer wifiApNode;
wifiApNode.Create(1);
allNodes.Add(wifiApNode);
The following lines of code define the channel used by the Wi-Fi nodes. The YansWifiChannelHelper class creates a channel object which implements the YANS channel model. The YANS channel implements the propagation model described in Yet Another Network Simulator, a paper published by Mathieu Lacage and Thomas R. Henderson. You can get the paper at http://cutebugs.net/files/wns2-yans.pdf. The default values of the YANS channel are used in this simulation.
YansWifiChannelHelper channel = YansWifiChannelHelper::Default ();
YansWifiPhyHelper phy = YansWifiPhyHelper::Default ();
The statement phy.SetChannel(channel.Create ( )); in the script makes sure that all the physical layer objects share the same underlying channel.
The next few lines of code configure the MAC layer. The class Ssid is responsible for setting up the SSID (service set identifier). SSID is a unique identifier attached to the packet header in wireless communication. All the nodes which are connected to a particular network should contain the same SSID.
WifiHelper wifi = WifiHelper::Default (); wifi.SetRemoteStationManager(ns3::AarfWifiManager); NqosWifiMacHelper mac = NqosWifiMacHelper::Default (); Ssid ssid = Ssid(ns-3-ssid); mac.SetType(ns3::StaWifiMac, Ssid, SsidValue(ssid), ActiveProbing, BooleanValue(false));
The next two lines of code use the Install() method to create Wi-Fi devices on the two Wi-Fi station nodes. But we havent dealt with any code configuring the Wi-Fi AP node. But in the downloaded full script of wireless.cc , you will see code to handle the MAC layer of the Wi-Fi AP node.
NetDeviceContainer staDevices;
staDevices = wifi.Install(phy, mac, wifiStaNodes);
After handling the physical and MAC layers of the Wi-Fi nodes, we also have to create a node connected to the Wi-Fi AP node by a point-to-point link (wired connection). Since we are familiar with this procedure, I havent explained it. The line p2pNodes.Add(wifiApNode); connects the point-to-point node object p2pNodes with the Wi-Fi AP node object wifiApNode. So this line of code connects the wired and wireless portions of our simulated network. After this, an object of the MobilityHelper class is created to fix the position and mobility model of various types of nodes. A method of class MobilityHelper called SetPositionAllocator() is used to fix the initial position of nodes before starting the simulation. Another method called SetMobilityModel() is called to fix the mobility model associated with a node. In our simulation, the two Wi-Fi nodes are assigned with a RandomWalk2dMobilityModel. This makes the movement of Wi-Fi nodes random. So the movement of the two Wi-Fi station nodes change with each execution of the script. The Wi-Fi AP node is assigned with a ConstantPositionMobilityModel and hence the Wi-Fi AP node is stationary. Finally the Install() method of MobilityHelper class is used to install the various mobility models on different nodes.
After this, the script wireless.cc proceeds like the previous scripts we have analysed. Just like previous simulation scripts, IPv4 addresses are allocated to all the nodes. An application is installed on top of the simulated nodes. A port address of 5555 is used by the server application to communicate with the client application.
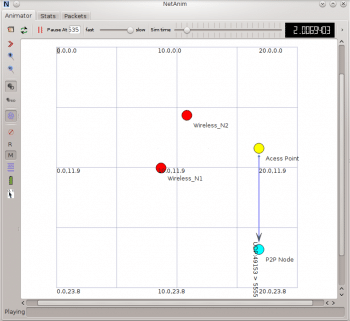
Now, only the following two lines of code need explanation. These lines deal with the animation trace file. In the code anim is an object of the class AnimationInterface. Here, the first line of code accesses one Wi-Fi station node and labels it as Wireless_N1. The second line of code sets the colour of the Wi-Fi station node in the NetAnim animation. An ordered triplet corresponding to the RGB colour code is used to denote the colour of the nodes. Here, we have the triplet as (255, 0, 0) and you can see a red coloured Wi-Fi station node in the NetAnim window.
anim.UpdateNodeDescription(wifiStaNodes.Get(0), Wireless_N1); anim.UpdateNodecolour(wifiStaNodes.Get(0), 255, 0, 0);
Execute the following code in a terminal opened in the directory ns/ns-allinone-3.22/ns-3.22 to run the ns-3 script wireless.cc.
./waf
./waf -- run scratch/wireless
On execution, the terminal will display some log information, which I have saved in a text file titled LOG_INFORMATION.txt and this file is also included in the downloadable Zip file. Figure 1 shows the NetAnim window running the animation trace file wireless.xml generated by wireless.cc.

Plotting graphs with ns-3 data
The saying A picture paints a thousand words is true even in the field of scientific research. The results presented by a thousand page treatise can often be summarised as an elegant graph. Your research will be followed more widely and appreciated if you could represent the results in the form of a graph. The very popular plotting tool called gnuplot is used for plotting graphs from ns-3 data. Keep in mind that even though the name of this tool starts with gnu it doesnt have anything to do with the GNU Project and neither does it support the GNU GPL. Both 2-dimensional and 3-dimensional plots are possible with gnuplot. The function plot is used for plotting 2D graphs and the function splot is used for plotting 3D graphs. The input for the 2D plot is a file containing two-column numeric data and the input for the 3D plot is a file containing three-column numeric data. So everything boils down to the process of obtaining the data file that can be given as an input to the plot functions of gnuplot.
There are two different ways to do this in ns-3. In the first method, the role of ns-3 is just to produce the trace file. Afterwards, this trace file is processed by some Linux commands or text processing utilities like AWK or Perl to extract two-column or three-column numeric data, as required. This data is then given as an input to gnuplot. This method is simple if you know how to extract data with Linux commands or text processing utilities, in which case, no additional knowledge of ns-3 is required.
The code below shows the Linux command cut being used to extract two-column data from the trace file wireless.tr generated by wireless.cc. The extracted two-column data is redirected to a file called plot_input. This file is then used by gnuplot to plot the graph.
# cut -d -f2,28 wireless.tr > plot_input # gnuplot gnuplot> set xlabel Time gnuplot> set ylabel Packet Size gnuplot> set title Graph gnuplot> plot plot_input gnuplot> exit
The option -d of the cut command tells which character is used as a field delimiter for deciding individual columns. Here, the delimiter is whitespace. An instance of the gnuplot utility is invoked with the command gnuplot. The commands set xlabel and set ylabel are used to set the X-axis and Y-axis labels. The title of the graph is given by the command settitle. Since we are dealing with two-column data, the 2D function plot is used. The name of the input file should be enclosed within double quotes. With this we will obtain a graph but the use of Linux commands may not always give us all the required data to produce a graph. In such situations, we might be forced to use AWK or Perl scripts.
The previous method of plotting graphs depends heavily on our knowledge of Linux commands and text processing utilities, and the data is always extracted from the trace file. What if we need to access data directly from various ns-3 modules? In order to access data directly from the source to plot a graph, ns-3 provides a class called Gnuplot. The code below shows an ns-3 script called graph.cc using the Gnuplot class.
#include ns3/gnuplot.h
#include <fstream>
#include <math.h>
using namespace ns3;
using namespace std;
int main (int argc, char *argv[])
{
double x,y,t;
Gnuplot plot(graph.eps);
plot.SetTitle(2-D Graph);
plot.SetTerminal(postscript);
plot.SetLegend(X Axis, Y Axis);
plot.AppendExtra(set xrange [-2:2]);
plot.AppendExtra(set yrange [-2:2]);
Gnuplot2dDataset dataset;
dataset.SetTitle(2-D Data);
dataset.SetStyle(Gnuplot2dDataset::LINES);
for(t = 0; t <= 10; t+=0.1)
{
x=sin(2*t);
y=sin(4*t);
dataset.Add(x, y);
}
plot.AddDataset(dataset);
ofstream plotFile(graph.plt);
plot.GenerateOutput(plotFile);
plotFile.close();
return 0;
}
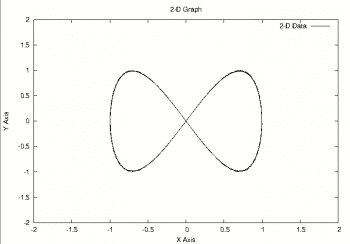
The instruction Gnuplot plot (graph.eps); creates an object of the Gnuplot class and names the output file as graph.eps. This object is then used in the instruction plot.SetTerminal(postscript);to decide the output type. The graphic format associated with PostScript is Encapsulated PostScript with the extension .eps. The instruction Gnuplot2dDataset dataset; creates a dataset to which the source file will add data for plotting. The instruction dataset.SetStyle(Gnuplot2dDataset::LINES); decides the style of drawing the graph. The other styles for drawing the graph include LINES_POINTS, POINTS, DOTS, etc. On execution, the ns-3 script graph.cc (the command for execution is ./waf; ./waf –run scratch/graph) will produce a file called graph.plt , which contains all the instructions required for generating the graph. You can generate the image file containing the graph graph.eps by executing the command gnuplot graph.plt. For better visualisation, I have used the functions sin(2t) and sin(4t) for generating the X and Y coordinates of the graph. Figure 2 shows the graph generated by the plot file.
We have now discussed the different ways to represent information obtained from ns-3 in a neat and concise way. What else remains to be discussed about ns-3? As I have mentioned in the very first part of this series, ns-3 is not a single tool. It is the collection of a set of utilities and languages to achieve the goal of network simulation. Before winding up this series, we still need to discuss the use of Python in ns-3 and pcap based tracing. But that is not all. We also need to explore the source code of ns-3 briefly and understand the infinite possibilities while expanding the source code.


How is it possible to change the node color when a node reaches to a specific position? For example X=10 Y=25.
Thanks.
Source code is not available from the link provided , can you plz upload the source code for wireless.cc?
Thanks