Have you ever wondered which module is slowing down your Python program and how to optimise it? Well, there are profilers that can come to your rescue.
Profiling, in simple terms, is the analysis of a program to measure the memory used by a certain module, frequency and duration of function calls, and the time complexity of the same. Such profiling tools are termed profilers. This article will discuss the line_profiler for Python.
Installation
Installing pre-requisites: Before installing line_profiler make sure you install these pre-requisites:
a) For Ubuntu/Debian-based systems (recent versions):
sudo apt-get install mercurial python python3 python-pip python3-pip Cython Cython3
b) For Fedora systems:
sudo yum install -y mercurial python python3 python-pip
Note: 1. I have used the y argument to automatically install the packages after being tracked by the yum installer.
2. Mac users can use Homebrew to install these packages.
Cython is a pre-requisite because the source releases require a C compiler. If the Cython package is not found or is too old in your current Linux distribution version, install it by running the following command in a terminal:
sudo pip install Cython
Note: Mac OS X users can install Cython using pip.
Cloning line_profiler: Let us begin by cloning the line_profiler source code from bitbucket.
To do so, run the following command in a terminal:
hg clone https://bitbucket.org/robertkern/line_profiler
The above repository is the official line_profiler repository, with support for python 2.4 – 2.7.x.
For python 3.x support, we will need to clone a fork of the official source code that provides python 3.x compatibility for line_profiler and kernprof.
hg clonehttps://bitbucket.org/kmike/line_profiler
Installing line_profiler: Navigate to the cloned repository by running the following command in a terminal:
cd line_profiler
To build and install line_profiler in your system, run the following command:
a) For official source (supported by python 2.4 – 2.7.x):
sudo python setup.py install
b) For forked source (supported by python 3.x):
sudo python3 setup.py install
Using line_profiler
Adding profiler to your code: Since line_profiler has been designed to be used as a decorator, we need to decorate the specified function using a @profile decorator. We can do so by adding an extra line before a function, as follows:
@profile
def foo(bar):
.....
Running line_profiler: Once the slow module is profiled, the next step is to run the line_profiler, which will give line-by-line computation of the code within the profiled function.
Open a terminal, navigate to the folder where the .py file is located and type the following command:
kernprof.py -l example.py; python3 -m line_profilerexample.py.lprof
Note: I have combined both the commands in a single line separated by a semicolon; to immediately show the profiled results.
You can run the two commands separately or run kernprof.py with v argument to view the formatted result in the terminal.
kernprof.py -l compiles the profiled function in example.py line by line; hence, the argument -l stores the result in a binary file with a .lprof extension. (Here, example.py.lprof)
We then run line_profiler on this binary file by using the -m line_profiler argument. Here -m is followed by the module name, i.e., line_profiler.
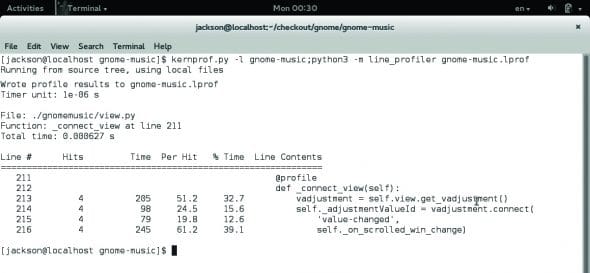
Case study: We will use the Gnome-Music source code for our case study. There is a module named _connect_view in the view.py file, which handles the different views (artists, albums, playlists, etc) within the music player. This module is reportedly running slow because a variable is initialised each time the view is changed.
By profiling the source code, we get the following result:
Wrote profile results to gnome-music.lprof
Timer unit: 1e-06 s

File: ./gnomemusic/view.py
Function: _connect_view at line 211
Total time: 0.000627 s

Line # Hits Time Per Hit % Time Line Contents
=============================================================
211 @profile
212 def _connect_view(self):
213 4 205 51.2 32.7 vadjustment = self.view.get_vadjustment()
214 4 98 24.5 15.6 self._adjustmentValueId =
vadjustment.connect(
215 4 79 19.8 12.6 'value-changed',
216 4 245 61.2 39.1 self._on_scrolled_win_change)
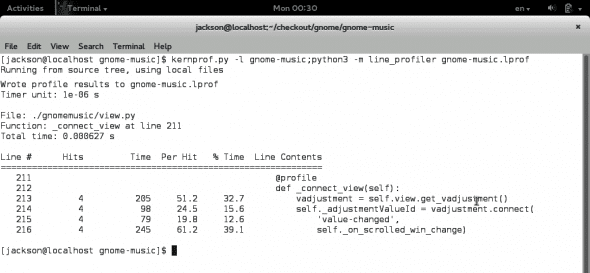
In the above code, line no 213, vadjustment = self.view.get_vadjustment(), is called too many times, which makes the process slower than expected. After caching (initialising) it in the init function, we get the following result tested under the same condition. You can see that there is a significant improvement in the results (Figure 2).
Wrote profile results to gnome-music.lprof
Timer unit: 1e-06 s

File: ./gnomemusic/view.py
Function: _connect_view at line 211
Total time: 0.000466 s

Line # Hits Time Per Hit % Time Line Contents
============================================================
211 @profile
212 def _connect_view(self):
213 4 86 21.5 18.5 self._adjustmentValueId =
vadjustment.connect(
214 4 161 40.2 34.5 'value-changed',
215 4 219 54.8 47.0 self._on_scrolled_win_change)
Understanding the output
Here is an analysis of the output shown in the above snippet:
- Function: Displays the name of the function that is profiled and its line number.
- Line#: The line number of the code in the respective file.
- Hits: The number of times the code in the corresponding line was executed.
- Time: Total amount of time spent in executing the line in Timer unit (i.e., 1e-06s here). This may vary from system to system.
- Per hit: The average amount of time spent in executing the line once in Timer unit.
- % time: The percentage of time spent on a line with respect to the total amount of recorded time spent in the function.
- Line content: It displays the actual source code.
Note: If you make changes in the source code you need to run the kernprof and line_profiler again in order to profile the updated code and get the latest results.
Advantages
Line_profiler helps us to profile our code line-by-line, giving the number of hits, time taken for each hit and %time. This helps us to understand which part of our code is running slow. It also helps in testing large projects and the time spent by modules to execute a particular function. Using this data, we can commit changes and improve our code to build faster and better programs.
References
[1] http://pythonhosted.org/line_profiler/
[2] http://jacksonisaac.wordpress.com/2013/09/08/using-line_profiler-with-python/
[3] https://pypi.python.org/pypi/line_profiler
[4] https://bitbucket.org/robertkern/line_profiler
[5] https://bitbucket.org/kmike/line_profiler


