

Zeek is an open source network security monitoring tool. This article discusses its capabilities, and gives a short tutorial on how to get started with it.
A network is a collection of computers, servers, wired or wireless devices or any other devices connected to each other to allow data sharing. For example, the Internet is a network where billions and millions of devices are connected all over the globe. A smaller example is our home network, which connects our laptop, mobile, hubs and router.
Network analysis is a method used to examine the data that is transferred between two devices in a network. It helps to understand the architecture of the network and also investigates any malicious activity. There are several open source tools used to analyse network traffic. One among them is Zeek.
Zeek: An open source network monitoring tool
Zeek is a passive, open source network traffic analyser tool. Many companies and operators use Zeek as a NSM (network security monitor), as it is very helpful for investigating suspicious or malicious activity in the network. This tool also supports a wide range of traffic analysis tasks beyond the cybersecurity domain, including performance measurement and troubleshooting.
Zeek logs network activity in a separate file. These logs include all the data like HTTP sessions, requested URIs, MIME types, server responses, DNS requests, SSL certificates, key content of SMTP sessions, and much more. All the data is written in a well-structured, tab separated or JSON format.
In addition to this, Zeek can perform a few special tasks like extracting files from HTTP sessions, detecting malware, detecting SSH brute forcing, and validating SSL certificates.
Installing Zeek
To install Zeek on a Debian based Linux system, follow the steps given below and execute the commands as shown.
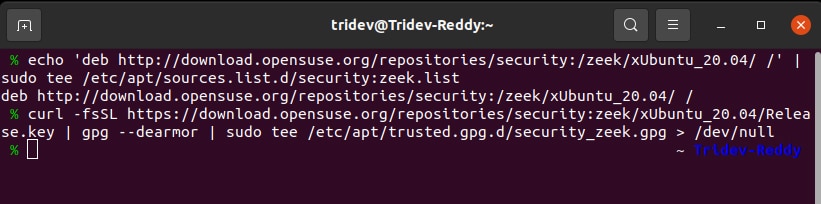
Step 1: Add the Zeek repository to the sources.list file by executing the following command:
echo ‘deb http://download.opensuse.org/repositories/security:/ zeek/xUbuntu_20.04/ /’ | sudo tee /etc/apt/sources.list.d/security:zeek.list
Next, run the following command:
curl -fsSL https://download.opensuse.org/repositories/security:zeek/xUbuntu_20.04/Release.key | gpg --dearmor | sudo tee /etc/apt/trusted.gpg.d/security_zeek.gpg > /dev/null
The output looks like what is shown in Figure 1.
Step 2: Next, we need to update the system repositories, as follows:
sudo apt update
Step 3: Now install Zeek from apt:
sudo apt install zeek
During the installation, you will be asked to select some Postfix settings. Select the website and leave the remaining settings as default.
Step 4: Add Zeek binary path to PATH:
echo “export PATH=$PATH:/opt/zeek/bin” >> ~/.bashrc
source ~/.bashrc
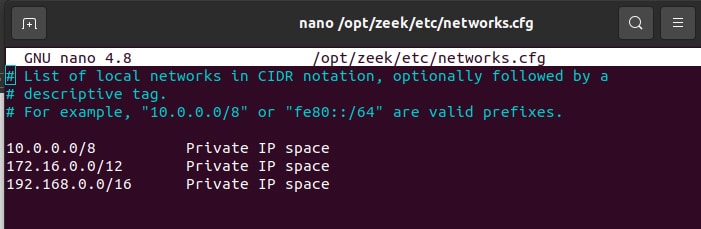
Step 5: Now we need to configure Zeek using the .cfg file. We must mention the local network that we are going to monitor in opt/zeek/etc/networks.cfg.
The output of the file should look something like Figure 3.
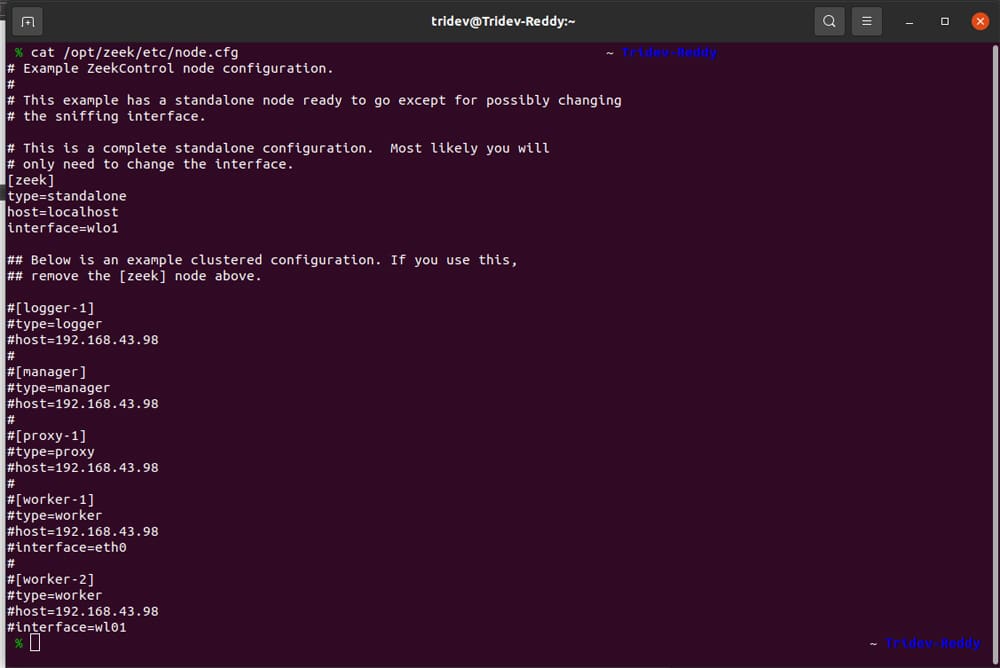
Step 6: We can run Zeek either in standalone mode or in a cluster setup. To define whether to run in a cluster or standalone setup, you need to edit the
/opt/zeek/etc/node.cfg configuration file.
For a standalone configuration, there must be only one Zeek node defined in this file. For a cluster configuration, there must be a manager node, a proxy node, and one or more worker nodes.
As we are using standalone mode now, just leave everything to default and change the interface name in [zeek] to the interface of your network. The output should look similar to Figure 4.
Step 7: Now we need to validate the configurations. For that, execute the following command:
cd opt/zeek/bin
sudo ./zeekctl check
If the settings are configured properly, you can see the output as:
zeek scripts are ok.
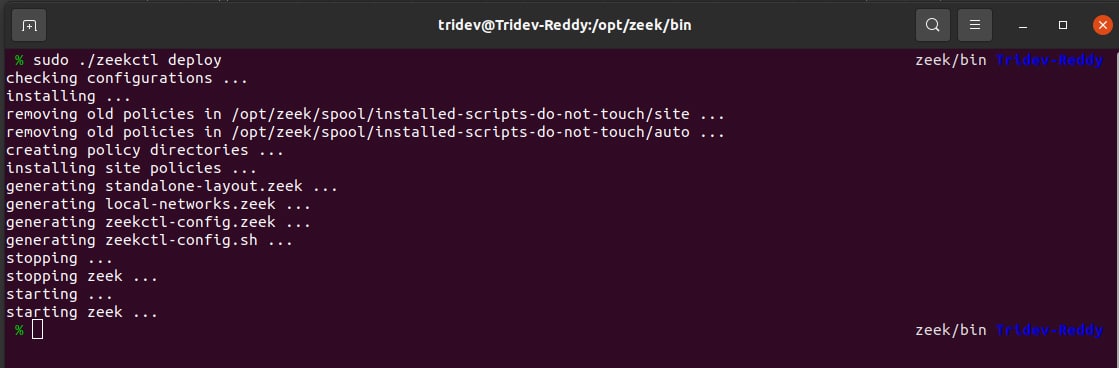
Step 8: Once we are ready with the configuration file, we need to deploy Zeek configurations. For doing that, execute the following command in the same directory:
sudo ./zeekctl deploy
On successful deployment, the output on the terminal will be as shown in Figure 4.
Step 9: Next, we need to check the status of Zeek. The output of the command given below will show the status with PID:
sudo ./zeekctl status
Zeek in action
Here’s a quick demo on how to sniff data and analyse logs using Zeek. Start Zeek using the command:
./zeekctl start
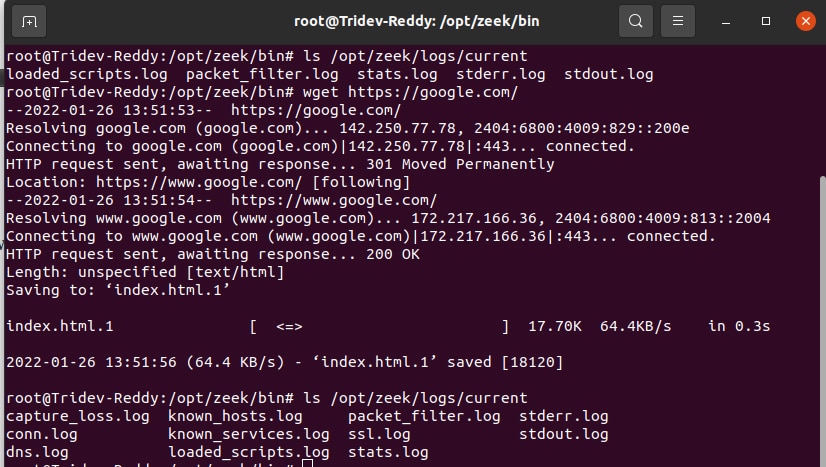
To demonstrate and generate some traffic, crawl through the Web page and grab index.html from Google.com and also ping Google:
ping 8.8.8.8
Figure 5 shows that there are a few more files in the logs/current directory. Once Zeek is stopped, these files will be stored in a separate new folder with the current date. After stopping the zeek service, the files in the current directory will be deleted but you do not need to worry as they will be stored in a new folder.
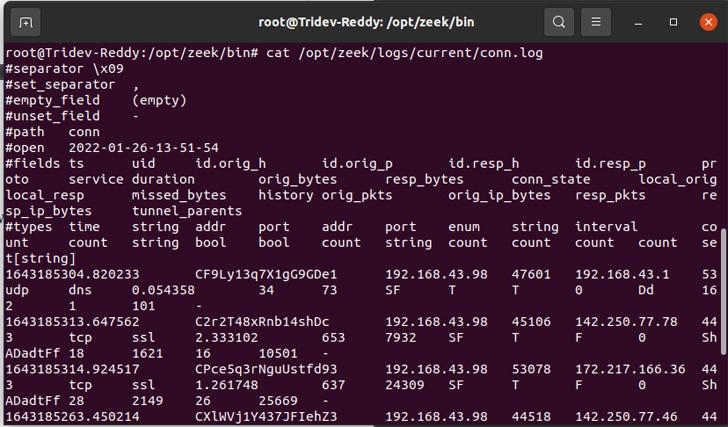
Let us see a file named conn.log and analyse the data.
The complete data that has been sniffed can be seen clearly in Figure 6 — the IP from which the traffic is generated, to which IP, UID, time, etc. This is how we use Zeek to analyse network traffic.
Another cool feature of Zeek is its capability to import any pcap file and analyse the traffic from that file using the argument -r:
./zeek -r
So, we have seen how to get started with Zeek. You can try out other features of Zeek as you start using it.
Faster log analysis with zeek-cut and UNIX tools
As evident from Figure 6, with the high amount of network transactions, the log files become over cluttered and difficult to read. In such scenarios, we may want to filter out only certain columns and/or certain rows. The utility zeek-cut, provided as a part of the Zeek package itself, can be of great help here, as it allows us to pick up certain columns of data.
The syntax is simple:
./zeek-cut < log_file_name columns_to_be_extracted
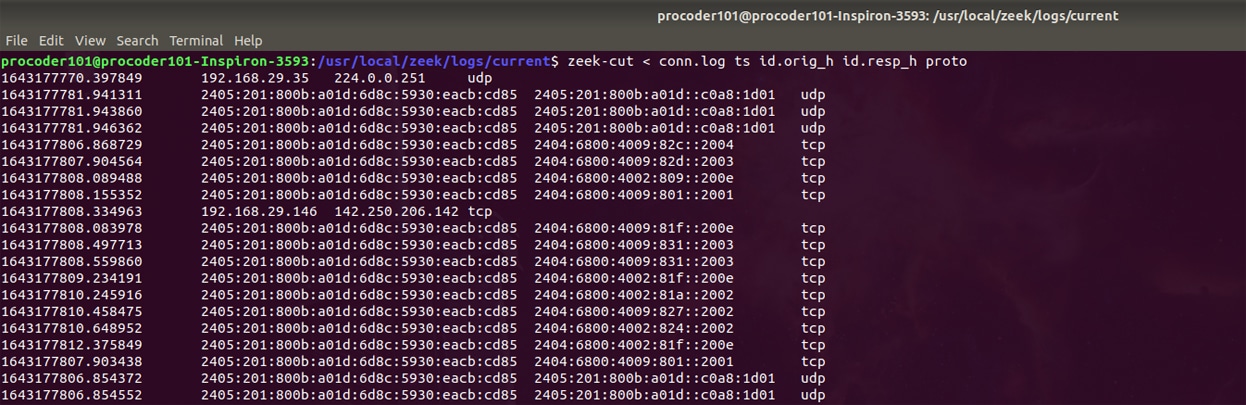
For example, we may try to pick out only the time stamp, the origin address, the destination address and the protocol used from a certain conn.log file. This can be done by running:
./zeek-cut < conn.log ts id.orig_h id.resp_h proto
Figure 7 shows some specific columns extracted from the log file with zeek-cut.
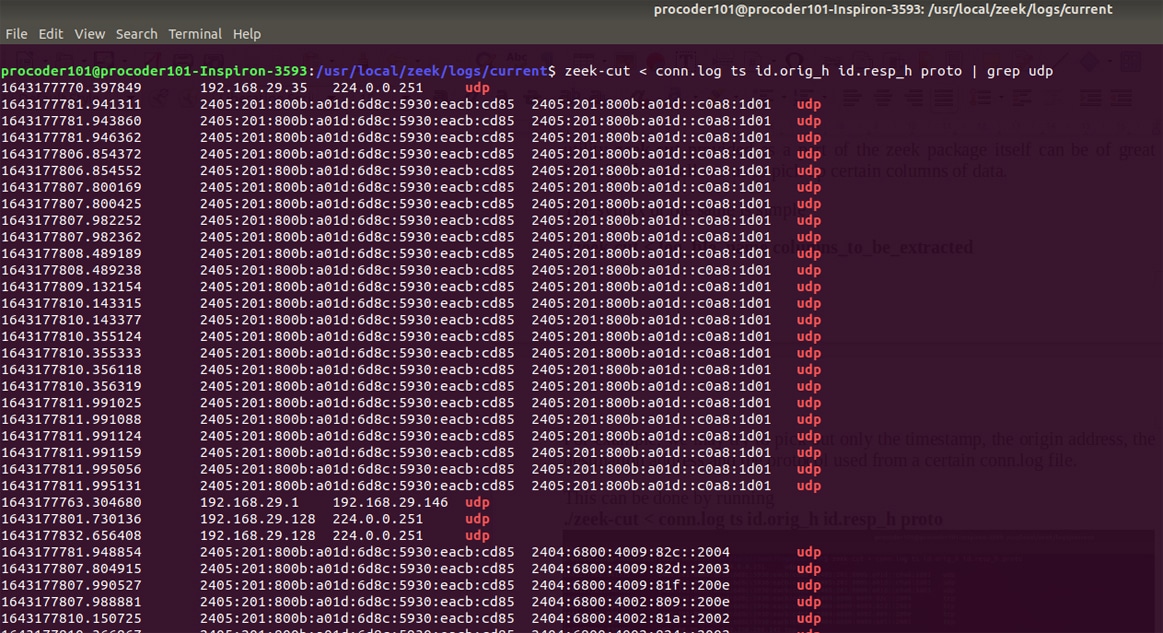
We can still see a lot of information in the output. So, UNIX tools like grep and sort can be used to manipulate the output. For example, if we want to filter out only the udp packets, the grep command can be used:
./zeek-cut < conn.log ts id.orig_h id.resp_h proto | grep udp
Figure 8 shows the output on filtering a particular data udp using grep.
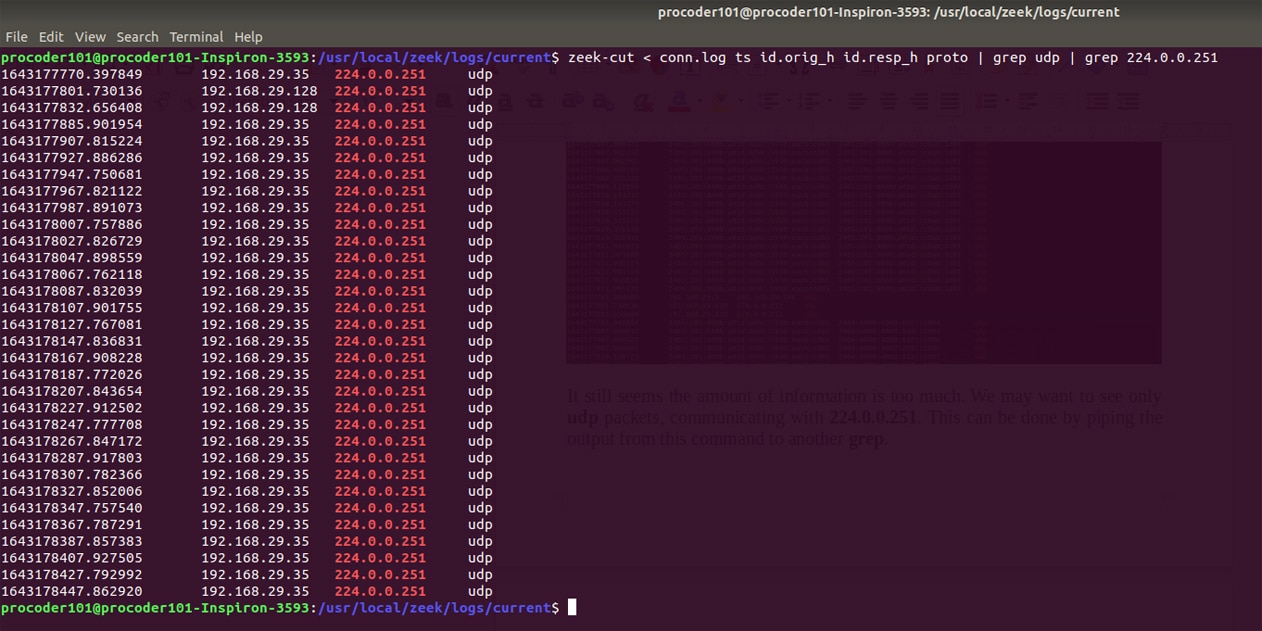
This can be further filtered to get the details with any single IP communicating using udp:
./zeek-cut < conn.log ts id.orig_h id.resp_h proto | grep udp | grep 224.0.0.251
Figure 9 shows the output when the data is filtered for a particular address. You can use grep and sort to get more customised output.
Acknowledgements
The authors are grateful to Sibi Chakkaravarthy Sethuraman, Kumar Debasis, Sudhakar T. and Ganesh Reddy Karri at the School of Computer Science and Engineering, VIT-AP, for their continuous guidance and support, and give a special thanks to the AIR (Artificial Intelligence and Robotics) Center.


