


Embrace the potential of Lightrun, a powerful logging and monitoring framework, to streamline operations, reduce maintenance efforts, and gain deeper insights into the health and performance of your Kubernetes applications in the cloud.
Observability is very important to understand the behaviour of cloud resources and monitor their health. There are two options available for choosing observability services – native services provided by cloud service providers (like Azure, AWS and GCP) and third party services like Lightrun, Grafana and Prometheus. Third party tools are cloud-agnostic and can be easily integrated into the cloud services.
Real-time monitoring and tracking of resources plays an important role in cloud architecture as it helps to understand the behaviour, health status and utilisation of cloud services easily as well as to drive CloudOps. Operational metrics in a cloud environment, like logs and usage traces, are often high in volume making their analysis a tedious task. However, analysing, managing and monitoring these metrics can provide valuable insights into performance, usage patterns and application/infrastructure health. Observability tools like Lightrun prove to be handy in visually interpreting monitoring logs through a dashboard to identify anomalous behaviour or check the health of an application.
This is more complex in container applications in cloud platforms (private cloud or public cloud). Real-time monitoring of health-checks, status, logs and even notification of Kubernetes services, along with getting diagnostic information in real-time, are common features of cloud services. Designing an observability pattern led solution for the monitoring and management of services requires quick analysis of critical issues on any cloud platform. Infrastructure monitoring and observability are important for any cloud architecture; these must provide a solution that caters to business goals while ensuring cost-effective maintenance and operational support.
Lightrun is a powerful logging and monitoring framework, which can be used to dynamically add debug/log statements in running Java applications. It also allows to add metrics, logs and traces to monitor trends in the application’s running state of defined expressions. In a production running application, this kind of dynamic monitoring service helps to troubleshoot applications in their ‘as is’ condition without altering the code by adding debug statements and rebuilding/redeploying applications. Another key advantage of Lightrun is its dynamic logging nature, allowing configuration of the time interval, and line numbers to insert log and log level (debug, info, error, to name a few). This reduces the actual logging size stored in the disk as only the required logs generated for debugging are kept.
Importance of logging and monitoring of running containers
Observability services, like logging and telemetry monitoring, use various metrics from infrastructure and platform services to troubleshoot any non-functional issues like performance, scalability and right-sizing requirements.
When working with Kubernetes applications (e.g., AKS in Azure, EKS in AWS or GKE in Google Cloud), we can enable an integrated native logging service with Lightrun monitoring services. It requires a Lightrun agent to be enabled to collect various metrics (as per configuration) and send it to the telemetry store for dashboard visualisation and other observability requirements.
Observability is based on three kinds of data.
- Information: This helps us collect vital statistics about the platform’s health, alerts, failures, etc.
- Inference: This is conceived from the information gathered.
- Insights: Based on these predictions, action is taken for recovering the platform in case of failures or enable proactive action like vertical scaling of services.
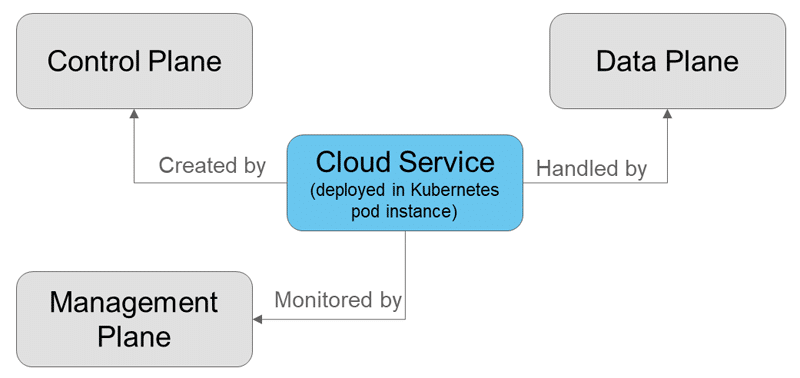
Operational activities in cloud platforms like Azure Kubernetes Service (AKS) are typically divided as control plane and data plane. Control plane is the driver, which can be used to create and manage any cloud resource. Data plane is the operational activity, which handles the capabilities of the resources created and managed by the control plane.
As an example, if you create a database, a storage account, a virtual machine or an app service, it is called a control plane. The actual operation activity like database operations, read/write activities on a storage account, and accessing virtual machines or application deployment on the app service are all functionalities of the data plane.
For better maintainability and agility, a management plane is separated from the control plane, and observability operations like monitoring and auditing are taken to the management plane. For example, in Azure, Azure Resource Manager (ARM) operations are termed as management plane activities.
This kind of resource management through control plane, data plane and management plane helps to control and manage security services, auditing, policy driven activities, activity logs and resource hierarchy services.
Similarly, in the AWS platform, Elastic Kubernetes Service (EKS) extension is a service connector, which helps to connect EKS or Fargate with monitoring, security, observability and governance tools. Extension connectors are available for popular instrumentation and log analysis tools like Lightrun and also native services like CloudWatch Lambda Insights and AppConfig.
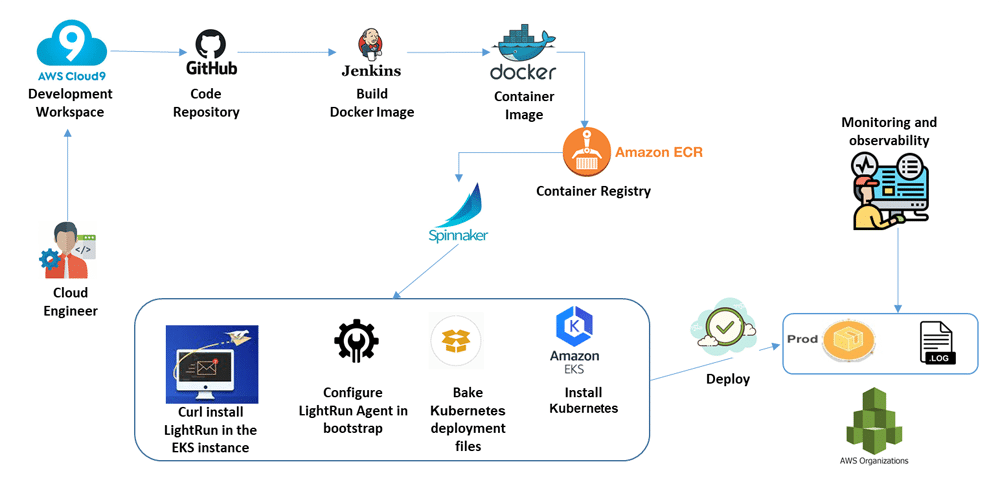
Deploying an EKS instance with Lightrun agent for logging and monitoring
Elastic Kubernetes Service (EKS) with Lightrun extension can be run in two modes – internal and external.
- The internal EKS extension process attaches as an instrumentation thread, as in-process to runtime, and enables automatic instrumentation for code.
- The external EKS extension process runs outside the application runtime and can be invoked or shutdown manually.
The internal process is helpful in the DevTest environment as we can instrument automatically in the background during any testing process. The external process is useful in production environments, allowing the instrumentation to be switched on/off at any time to collect telemetry data. Also, external processes can run before application warm start runs and continue even after the EKS service stops. This is helpful to understand performance issues through the invocation point for the bootstrap function (request/response).
Lightrun is handy for extended observability, metrics analytics and performance troubleshooting. It helps to analyse the filtered metrics by quickly setting up dashboards for unified observability and monitoring including container, software life cycle and IoT monitoring services. It can be integrated with Amazon Simple Notification Service (SNS) through topic subscription so that any notification from metrics analysis can be channelled to SNS notification alerts.
Dynamic instrumentation for logging and monitoring in an EKS application
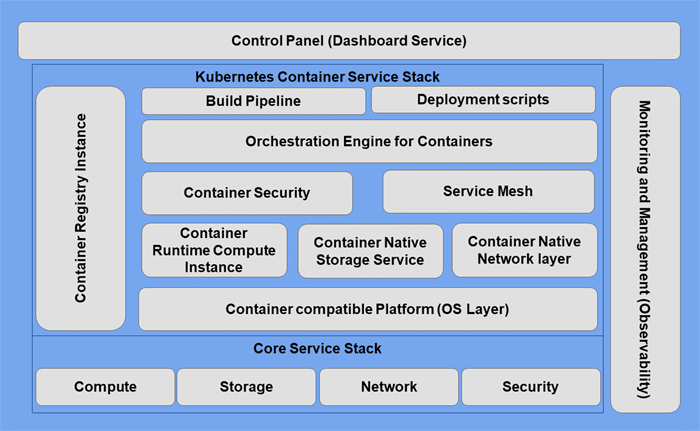
Kubernetes containers run as an integrated package of various stacks comprising infrastructure service, platform service and application service. Infrastructure service handles runtime OS layer services including container orchestration and infrastructure components like compute, storage and network services.
Platform services contain application runtime environments including Spring Boot for Java applications, bootstrap services for application runtime environment, security services and orchestration engines for containers. Both infrastructure services and platform services are enablers for applications to run in the container.
Application services include Spring Boot applications running on an EKS instance, as well as integrated management and monitoring services for native observability.
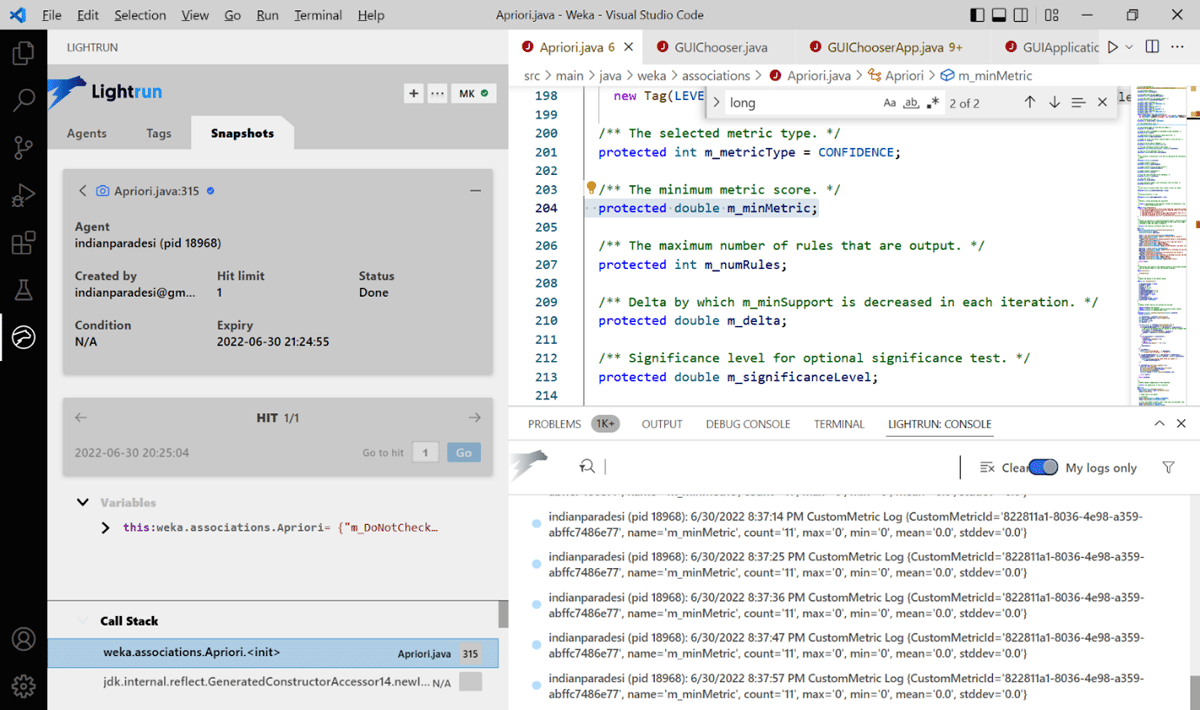
Using Lightrun, we can instrument the application runtime binary dynamically without restarting the application or adding debug/log statements to build/containerise application code.
If there aren’t enough logs added in the running Java container (e.g., Spring Boot application in EKS instance), we can just install the Lightrun agent and attach it to the runtime application by adding the command-line argument agentpath:<path>\lightrun_agent.dll, and run the application. This will enable bootstrapping observability agents to the application startup.
Lightrun can be integrated with IDEs like IntelliJ IDEA or VSCode. It can be used from on-premises deployable service or as Lightrun cloud service (PaaS model) to integrate with cloud native applications including Java, Python or Scala applications running in containers like EKS, AKS or GKE.
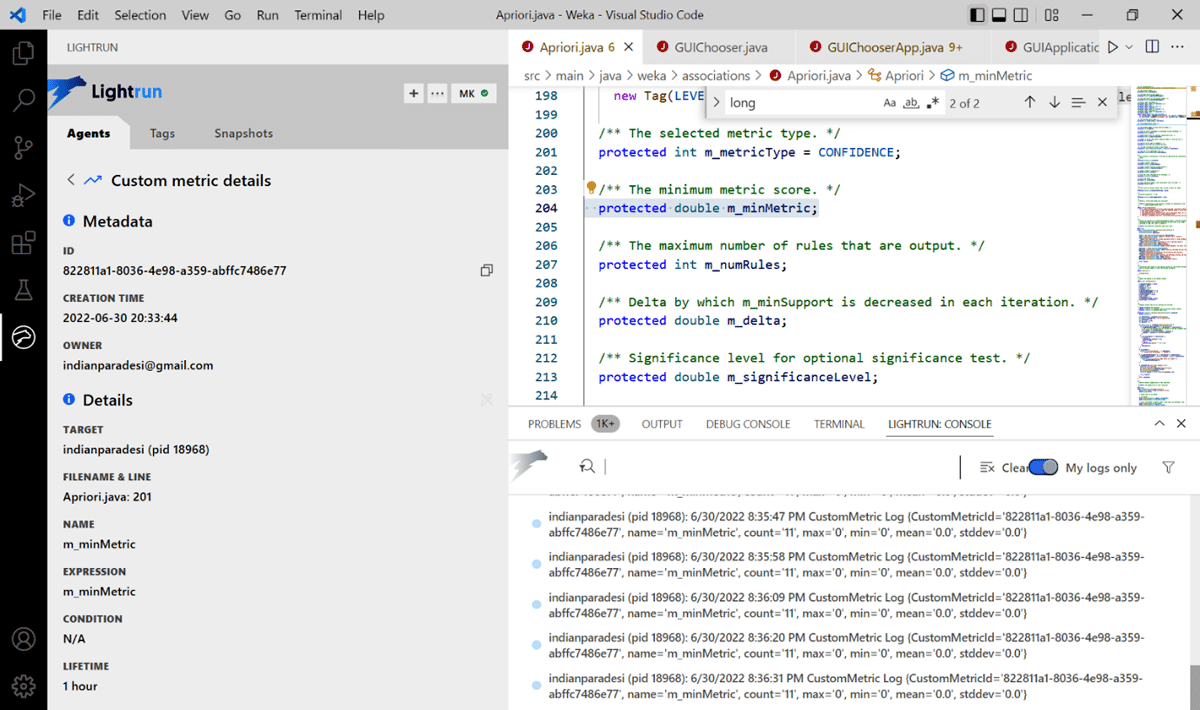
We can make use of Lightrun for improved debugging and application engineering activities like monitoring, management, logging and metrics collection of dynamically running containers. For example, if there is trouble making a piece of code in a function or event, we can add a snapshot to that line of code. When there is a call to that line of code, snapshot gets captured dynamically and can be used offline to understand the stack of call tree and analyse the flow of call.
We can also add dynamic logging or dynamic metrics in the form of expression or evaluation variables so that regular monitoring of these variables (in terms of change of value or change of expression at different intervals of the runtime) can be done and analysed to debug a particular flow of the application component.
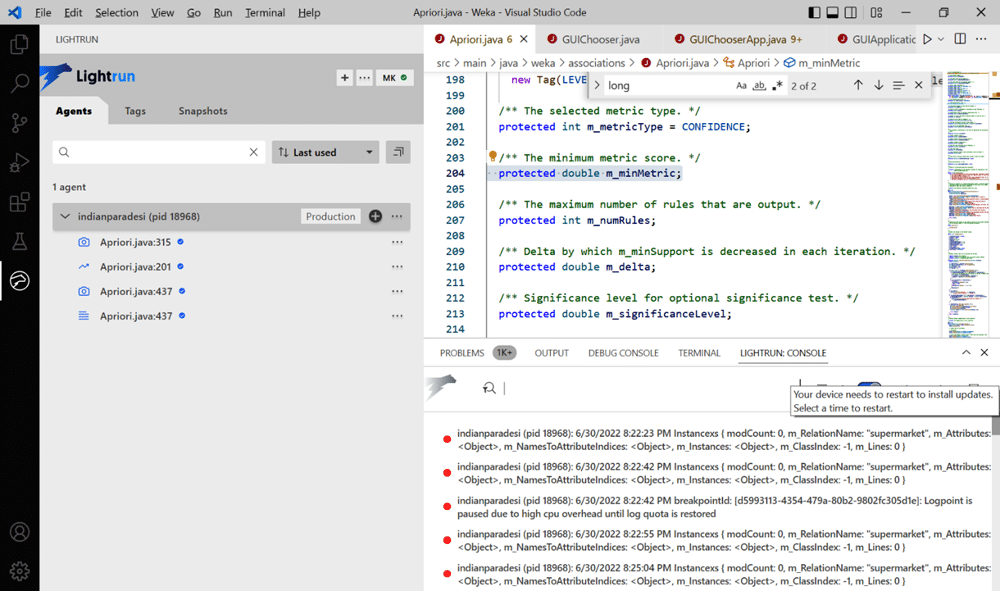
For the above example of running an EKS instance with Java containers on a Spring Boot application, I have taken the open source Weka application (data mining application) and deployed it using Kubectl.
Lightrun simplifies operational activities in site reliability engineering (SRE) to reduce the L2 and L3 activities of production support. It also integrates native monitoring and management for development teams using integrated native observability patterns. Dynamic log configuration reduces the overall log size and flexibly debugs the containers without re-creating the container image with additional code.


