


Cloud infrastructure must be continuously monitored to pre-empt service failures. Monitoror and Vigil are two excellent open source tools to help set up status pages for black box monitoring of IT infrastructure.
Modern cloud infrastructures are complicated and run both internal and external servers to deliver products and services 24/7. Keeping a close watch on each element of this infrastructure is critical for any technology-driven business, and monitoring solutions need to be proactive rather than reactive. Having an internal and/or external status page, which gives a quick overview to figure out what’s failing where, is a must-have tool for any modern IT team. Most enterprise monitoring solutions are way too expensive, especially for small to medium businesses. Let’s look at two amazing free and open source solutions to set up various kinds of status pages for black box monitoring of IT infrastructure. All you need to test these solutions is a running Docker engine on your machine, which is pretty common nowadays.
Monitoror wallboard
Our first free and open source status page solution is Monitoror. It’s also known as a monitoring wallboard as it’s a single page app consisting of different coloured rectangular tiles. Monitoror mainly has three kinds of general-purpose monitoring checks: ping, port and HTTP. The ping check verifies connectivity to a configured host, the port check verifies the port listening on a configured endpoint, and the HTTP check verifies the GET request to a URL. It also has special inbuilt checks for Azure DevOps, GitHub, GitLab, Jenkins, Pingdom and TravisCI. The wallboard highlights the configured tiles either in green or red based on whether a check passes or fails, respectively.
Now let’s see Monitoror in action. First, create a Docker network for test container(s) to communicate through the command docker network create statuspage-demo in a terminal. Next, create monitoror_stack.yml and config.json as shown below to launch a Monitoror stack and supply its configuration for our first demo, respectively. Here’s the content for monitoror_stack.yml and config.json:
monitoror_stack.yml

services:

monitoror:

image: monitoror/monitoror:${MTRRTAG:-latest}

ports:

- “38080:8080”

environment:

- “MO_CONFIG=/etc/config.json”

restart: unless-stopped

networks:

default:

name: statuspage-demo

external: true

config.json

{

“version”: “2.0”,

“columns”: 2,

“tiles”: [

{ “type”: “PING”, “params”: {“hostname”: “127.0.0.1”}},

{ “type”: “PORT”, “params”: {“hostname”: “129.0.0.1”, “port”: 8080}},

{ “type”: “HTTP-STATUS”, “params”: {“url”: “https://gogle.com”}},

{

“type”: “GROUP”,

“label”: “localhost PING/PORT/HTTP Tests”,

“tiles”: [

{

“type”: “PING”,

“params”: {

“hostname”: “128.0.0.1”

}

},

{

“type”: “PORT”,

“params”: {

“hostname”: “127.0.0.1”,

“port”: 8080

}

},

{

“type”: “HTTP-STATUS”,

“params”: {

“url”: “http://localhost:8080”

}

}

]

}

]

}
Let’s now analyse the Monitoror configuration. The configuration file defines an arrangement of the desired monitoring tiles in a given number of columns. If the columns are less than the number of tiles, the screen is filled vertically too. An array of tiles is defined for various monitoring checks on the wallboard. The ping, port and HTTP-status tiles are self-explanatory. We have also defined a tile of the type ‘group’, which shows a single rectangular area to represent multiple checks. The group tile will be red, showing information about failing check(s) in case a single or multiple checks in the group fail. This kind of tile is useful to pack in more checks in a limited single page area. Please go through the Monitoror documentation for the complete information on monitorable tiles and their respective parameters, etc. Even if you need to run Monitoror natively, go to the appropriate Golang static binary from its GitHub release page and run it after making that executable.
Execute the following command to launch the Monitoror container:
docker run -it --rm -v /var/run/docker.sock:/var/run/docker.sock:ro -v ./monitoror_stack.yml:/etc/compose/monitoror_stack.yml:ro docker docker compose -f /etc/compose/monitoror_stack.yml up -d
Finally, execute the following command to supply the required Monitoror configuration to the demo tiles monitoring localhost in its container, which is running on port 8080:
docker run -it --rm -v /var/run/docker.sock:/var/run/docker.sock:ro -v ./config.json:/etc/monitoror/config.json:ro -v ./monitoror_stack.yml:/etc/compose/monitoror_stack.yml:ro docker docker compose -f /etc/compose/monitoror_stack.yml cp /etc/monitoror/config.json monitoror:/etc/config.json
Now access the Monitoror wallboard page in your browser at localhost:38080 and you should see a page with monitoring tiles as shown in Figure 1.]
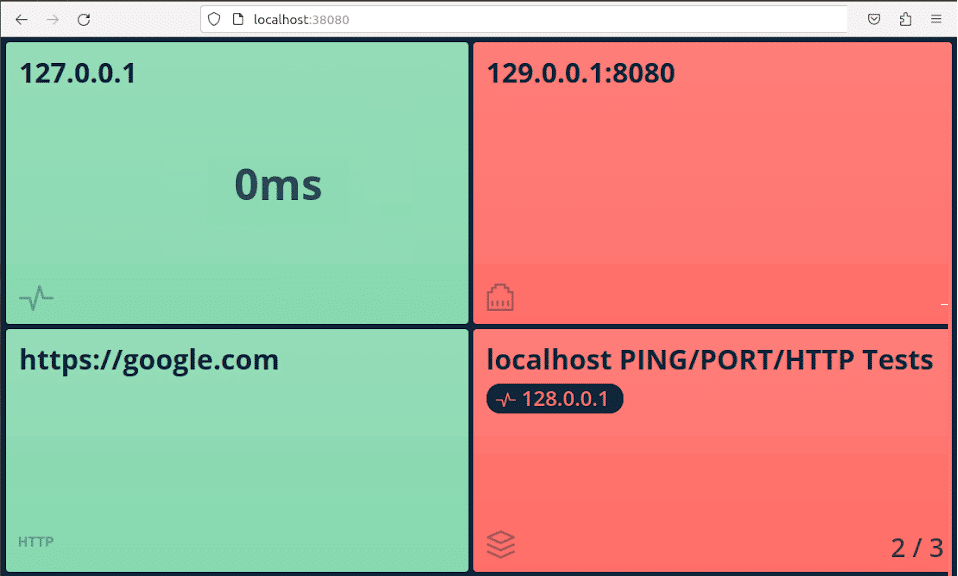
We have intentionally provided false IP addresses in the demo config file to show how failing tiles look on the wallboard. Monitoror picks up config changes as it checks for those at an interval while running. Now let’s correct the invalid IP addresses and introduce a typo in the HTTP-status tile by changing the config.json as shown below:
6,7c6,7

< { “type”: “PORT”, “params”: {“hostname”: “129.0.0.1”, “port”: 8080}},

< { “type”: “HTTP-STATUS”, “params”: {“url”: “https://google.com”}},

---

> { “type”: “PORT”, “params”: {“hostname”: “127.0.0.1”, “port”: 8080}},

> { “type”: “HTTP-STATUS”, “params”: {“url”: “https://gogle.com”}},

15c15

< “hostname”: “128.0.0.1”

---

> “hostname”: “127.0.0.1”
Next, provide Monitoror your new config through the following command:
docker run -it --rm -v /var/run/docker.sock:/var/run/docker.sock:ro -v ./config.json:/etc/monitoror/config.json:ro -v ./monitoror_stack.yml:/etc/compose/monitoror_stack.yml:ro docker docker compose -f /etc/compose/monitoror_stack.yml cp /etc/monitoror/config.json monitoror:/etc/config.json
The Monitoror wallboard should now reflect the new configuration, as shown in Figure 2.
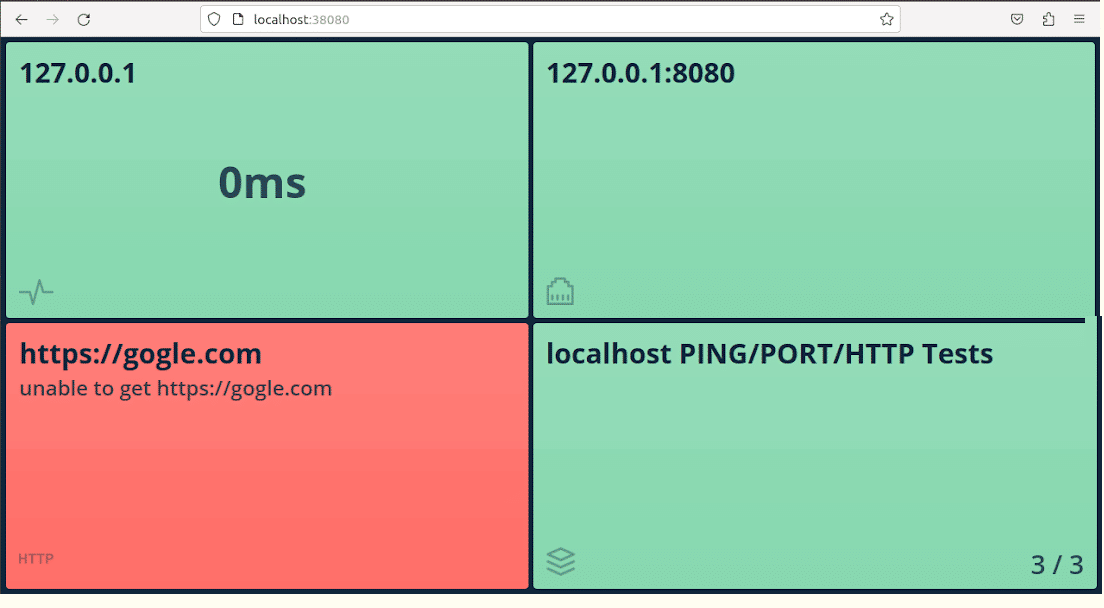
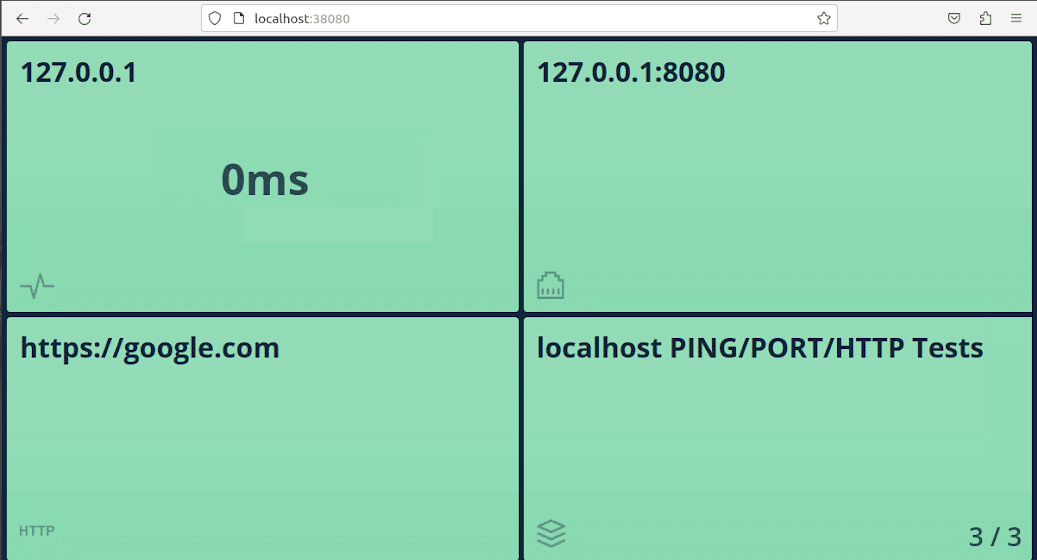
Correcting the typo in the HTTP tile URL and copying the new config should show only green on the wallboard, as shown in Figure 3.
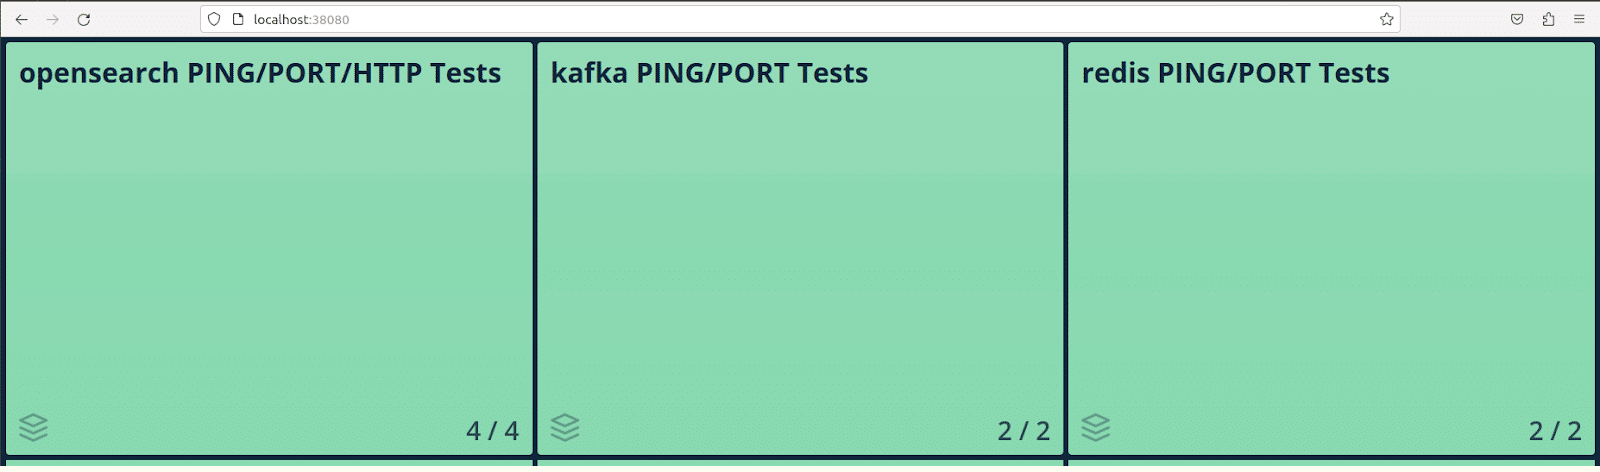
Our second demo is about using the Monitoror wallboard with tiles monitoring some popular modern cloud servers. Modify the monitoror_stack.yml as per the diff shown below to launch single instances of Kafka, OpenSearch and Redis as well:
diff monitoror_stack.yml

8a9,36

> - “MO_MONITORABLE_HTTP_SSLVERIFY=false”

> restart: unless-stopped

>

> opensearch:

> image: opensearchproject/opensearch:${OSRHTAG:-latest}

> environment:

> - “discovery.type=single-node”

> restart: unless-stopped

>

> kafka:

> image: apache/kafka-native

> ports:

> - “9092:9092”

> environment:

> KAFKA_LISTENERS: CONTROLLER://localhost:9091,HOST://0.0.0.0:9092,DOCKER://0.0.0.0:9093

> KAFKA_ADVERTISED_LISTENERS: HOST://localhost:9092,DOCKER://kafka:9093

> KAFKA_LISTENER_SECURITY_PROTOCOL_MAP: CONTROLLER:PLAINTEXT,DOCKER:PLAINTEXT,HOST:PLAINTEXT

> KAFKA_NODE_ID: 1

> KAFKA_PROCESS_ROLES: broker,controller

> KAFKA_CONTROLLER_LISTENER_NAMES: CONTROLLER

> KAFKA_CONTROLLER_QUORUM_VOTERS: 1@localhost:9091

> KAFKA_INTER_BROKER_LISTENER_NAME: DOCKER

> KAFKA_OFFSETS_TOPIC_REPLICATION_FACTOR: 1

> restart: unless-stopped

>

> redis:

> image: redis:${RDSSTAG:-latest}

> command: “redis-server --save 60 1 --loglevel warning”
Now modify the config.json to include tiles monitoring the new servers as per the diff shown below:
diff config.json

3c3

< “columns”: 2,

---

> “columns”: 3,

5,7d4

< { “type”: “PING”, “params”: {“hostname”: “127.0.0.1”}},

< { “type”: “PORT”, “params”: {“hostname”: “127.0.0.1”, “port”: 8080}},

< { “type”: “HTTP-STATUS”, “params”: {“url”: “https://google.com”}},

10c7

< “label”: “localhost PING/PORT/HTTP Tests”,

---

> “label”: “opensearch PING/PORT/HTTP Tests”,

12,30c9,28

< {

< “type”: “PING”,

< “params”: {

< “hostname”: “129.0.0.1”

< }

< },

< {

< “type”: “PORT”,

< “params”: {

< “hostname”: “127.0.0.1”,

< “port”: 8080

< }

< },

< {

< “type”: “HTTP-STATUS”,

< “params”: {

< “url”: “http://localhost:8080”

< }

< }

---

> {“type”: “PING”, “params”: {“hostname”: “opensearch”}},

> {“type”: “PORT”, “params”: {“hostname”: “opensearch”, “port”: 9200}},

> {“type”: “PORT”, “params”: {“hostname”: “opensearch”, “port”: 9600}},

> {“type”: “HTTP-STATUS”, “params”: {“url”: “https://admin:admin@opensearch:9200”}}

> ]

> },

> {

> “type”: “GROUP”,

> “label”: “kafka PING/PORT Tests”,

> “tiles”: [

> {“type”: “PING”, “params”: {“hostname”: “kafka”}},

> {“type”: “PORT”, “params”: {“hostname”: “kafka”, “port”: 9092}}

> ]

> },

> {

> “type”: “GROUP”,

> “label”: “redis PING/PORT Tests”,

> “tiles”: [

> {“type”: “PING”, “params”: {“hostname”: “redis”}},

> {“type”: “PORT”, “params”: {“hostname”: “redis”, “port”: 6379}}
Use the commands we used earlier for launching the previous demo and copying the Monitoror config respectively. You should see the Monitoror wallboard with the new server tiles as shown in Figure 4.
By now you should be feeling at home with Monitoror and its elegant capabilities to quickly up and run a monitoring wallboard. The following command cleans up the whole running stack once you’re done playing with Monitoror:
docker run -it --rm -v /var/run/docker.sock:/var/run/docker.sock:ro -v ./monitoror_stack.yml:/etc/compose/monitoror_stack.yml:ro docker docker compose -f /etc/compose/monitoror_stack.yml down
Vigil status page
The Monitoror single page monitor wall is quick but is suited only for a relatively smaller number of servers and services. Our next free and open source status page solution called Vigil is capable of handling a large number of servers and services with additional features like branding, alerting, announcements, etc.
Let’s now see Vigil in action. Create vigil_stack.yml and config.cfg as shown below:
vigil_stack.yml

services:

vigil:

image: valeriansaliou/vigil:${VGILTAG:-v1.27.0}

ports:

- “48080:8080”

restart: unless-stopped

networks:

default:

name: statuspage-demo

external: true

config.cfg

[server]

log_level = “debug”

inet = “0.0.0.0:8080”

workers = 4

manager_token = “REPLACE_THIS_WITH_A_VERY_SECRET_KEY”

reporter_token = “REPLACE_THIS_WITH_A_SECRET_KEY”

[assets]

path = “./res/assets/”

[branding]

page_title = “Vigil Localhost Test Status Page”

page_url = “https://teststatus.page/status”

company_name = “RNG”

icon_color = “#1972F5”

icon_url = “https://avatars.githubusercontent.com/u/226598?v=4”

logo_color = “#1972F5”

logo_url = “https://avatars.githubusercontent.com/u/226598?v=4”

website_url = “https://teststatus.page/”

support_url = “mailto:help@teststatus.page”

custom_html = “”

[metrics]

poll_interval = 60

poll_retry = 2

poll_http_status_healthy_above = 200

poll_http_status_healthy_below = 400

poll_delay_dead = 30

poll_delay_sick = 10

push_delay_dead = 20

push_system_cpu_sick_above = 0.90

push_system_ram_sick_above = 0.90

script_interval = 300

local_delay_dead = 40

[notify]

startup_notification = true

reminder_interval = 300

[notify.webhook]

hook_url = “https://webhook.site/4406e2a4-13cd-4c99-975c-d3456a148b26”

[probe]

[[probe.service]]

id = “ping”

label = “PING”

[[probe.service.node]]

id = “invalidiping”

label = “Invalid IP Ping”

mode = “poll”


replicas = [“icmp://129.0.0.1”]

[[probe.service]]

id = “port”

label = “PORT”

[[probe.service.node]]

id = “localhostport”

label = “Localhost Port 8080 Probe”

mode = “poll”

replicas = [“tcp://localhost:8080”]

[[probe.service]]

id = “http”

label = “HTTP”

[[probe.service.node]]

id = “googlehttp”

label = “Google Http Probe”

mode = “poll”

replicas = [“https://google.com”]
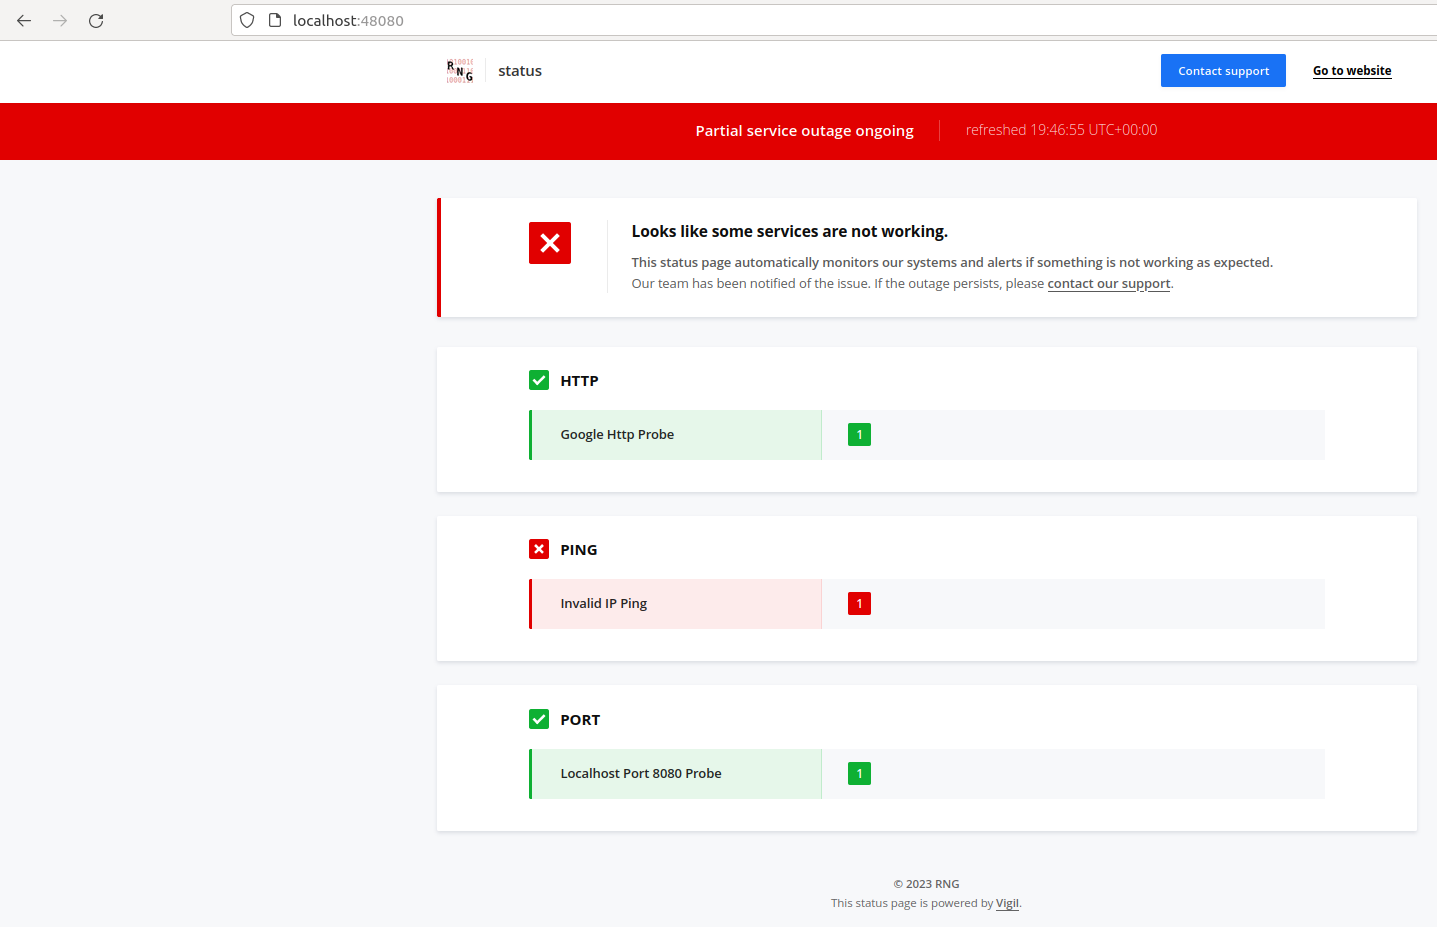
This configuration of Vigil with minimal necessary settings is self-explanatory. The server section controls which IP and port Vigil is running on with a defined number of parallel workers. The branding section contains settings for the status page title, URL, company name, page icon/logo, website/support, etc. The metrics section defines various intervals, delays, HTTP success range, etc, for the Vigil probes. Vigil notifies different monitoring events in various ways like email, Twilio, Slack, Telegram, XMPP, Webex, etc.
The test configuration uses a random webhook (it’ll be different for you) generated through webhook.site to see the events generated by Vigil during testing. The Vigil GitHub project provides a complete configuration file (link provided in the Reference section) for you to quickly go through all the settings provided by it. The probe section has various subsections to group and define various ICMP, TCP, and HTTP probes against various hosts/endpoints provided in the replica array. Vigil provides a script probe as well to cover monitoring checks not served by other probes. The Vigil GitHub project page provides a detailed description of all the configuration settings.
Now bring up the Vigil container using the following command:
docker run -it --rm -v /var/run/docker.sock:/var/run/docker.sock:ro -v ./vigil_stack.yml:/etc/compose/vigil_stack.yml:ro docker docker compose -f /etc/compose/vigil_stack.yml up -d
Next, provide the required configuration to Vigil with the following command:
docker run -it --rm -v /var/run/docker.sock:/var/run/docker.sock:ro -v ./vigil_stack.yml:/etc/compose/vigil_stack.yml:ro -v ./config.cfg:/etc/vigil.cfg:ro docker docker compose -f /etc/compose/vigil_stack.yml cp /etc/vigil.cfg vigil:/etc/vigil.cfg
Finally, restart Vigil for the configuration to take place using the following command:
docker run -it --rm -v /var/run/docker.sock:/var/run/docker.sock:ro -v ./vigil_stack.yml:/etc/compose/vigil_stack.yml:ro docker docker compose -f /etc/compose/vigil_stack.yml restart vigil
Now open localhost:48080 in your browser to see the Vigil status page, which should look like what’s shown in Figure 5.
We now move forward and add more external servers as shown in the diff below to replicate our second test setup done for Monitoror:
diff vigil_stack.yml

8a9,33

> opensearch:

> image: opensearchproject/opensearch:${OSRHTAG:-latest}

> environment:

> - “discovery.type=single-node”

> restart: unless-stopped

>

> kafka:

> image: apache/kafka-native

> environment:

> KAFKA_LISTENERS: CONTROLLER://localhost:9091,HOST://0.0.0.0:9092,DOCKER://0.0.0.0:9093

> KAFKA_ADVERTISED_LISTENERS: HOST://localhost:9092,DOCKER://kafka:9093

> KAFKA_LISTENER_SECURITY_PROTOCOL_MAP: CONTROLLER:PLAINTEXT,DOCKER:PLAINTEXT,HOST:PLAINTEXT

> KAFKA_NODE_ID: 1

> KAFKA_PROCESS_ROLES: broker,controller

> KAFKA_CONTROLLER_LISTENER_NAMES: CONTROLLER

> KAFKA_CONTROLLER_QUORUM_VOTERS: 1@localhost:9091

> KAFKA_INTER_BROKER_LISTENER_NAME: DOCKER

> KAFKA_OFFSETS_TOPIC_REPLICATION_FACTOR: 1

> restart: unless-stopped

>

> redis:

> image: redis:${RDSSTAG:-latest}

> command: “redis-server --save 60 1 --loglevel warning”

> restart: unless-stopped

>
Now change the previous configuration file as shown in the diff below including probes covering the Kafka, OpenSearch and Redis containers:
diff config.cfg

30,34d29

< push_delay_dead = 20

< push_system_cpu_sick_above = 0.90

< push_system_ram_sick_above = 0.90

< script_interval = 300

< local_delay_dead = 40

45,46c40,41

< id = “ping”

< label = “PING”

---

> id = “kafka”

> label = “KAFKA”

48,49c43,44

< id = “invalidiping”

< label = “Invalid IP Ping”

---

> id = “kafkaping”

> label = “Kafka Ping”

51c46,53

< replicas = [“icmp://129.0.0.1”]

---

> replicas = [“icmp://kafka”]

> reveal_replica_name = true

> [[probe.service.node]]

> id = “kafkaport9092”

> label = “Kafka Port 9092”

> mode = “poll”

> reveal_replica_name = true

> replicas = [“tcp://kafka:9092”]

54,55c56,57

< id = “port”

< label = “PORT”

---

> id = “opensearch”

> label = “OPENSEARCH”

57,58c59,60

< id = “localhostport”

< label = “Localhost Port 8080 Probe”

---

> id = “opensearchping”

> label = “Opensearch Ping”

60c62,86

< replicas = [“tcp://localhost:8080”]

---

> reveal_replica_name = true

> replicas = [“icmp://opensearch”]

> [[probe.service.node]]

> id = “opensearchport9200”

> label = “Opensearch Port 9200”

> mode = “poll”

> reveal_replica_name = true

> replicas = [“tcp://opensearch:9200”]

> [[probe.service.node]]

> id = “opensearchport9600”

> label = “Opensearch Port 9600”

> mode = “poll”

> reveal_replica_name = true

> replicas = [“tcp://opensearch:9600”]

> [[probe.service.node]]

> id = “opensearchttp9200”

> label = “Opensearch Http 9200”

> mode = “script”

> reveal_replica_name = true

> scripts = [

> ‘’’

> /usr/bin/curl -k https://admin:admin@opensearch:9200

> return $?

> ‘’’

> ]

63,64c89,96

< id = “http”

< label = “HTTP”

---

> id = “redis”

> label = “REDIS”

> [[probe.service.node]]

> id = “redisping”

> label = “Redis Ping”

> mode = “poll”

> reveal_replica_name = true

> replicas = [“icmp://redis”]

66,67c98,99

< id = “googlehttp”

< label = “Google Http Probe”

---

> id = “redisport6379”

> label = “Redis Port 6379”

69c101,102

< replicas = [“https://google.com”]

---

> reveal_replica_name = true

> replicas = [“tcp://redis:6379”]
Execute the commands used previously to launch containers, copy the updated config and restart Vigil respectively. Now refresh the status page and you should see the updated page as shown in Figure 6.
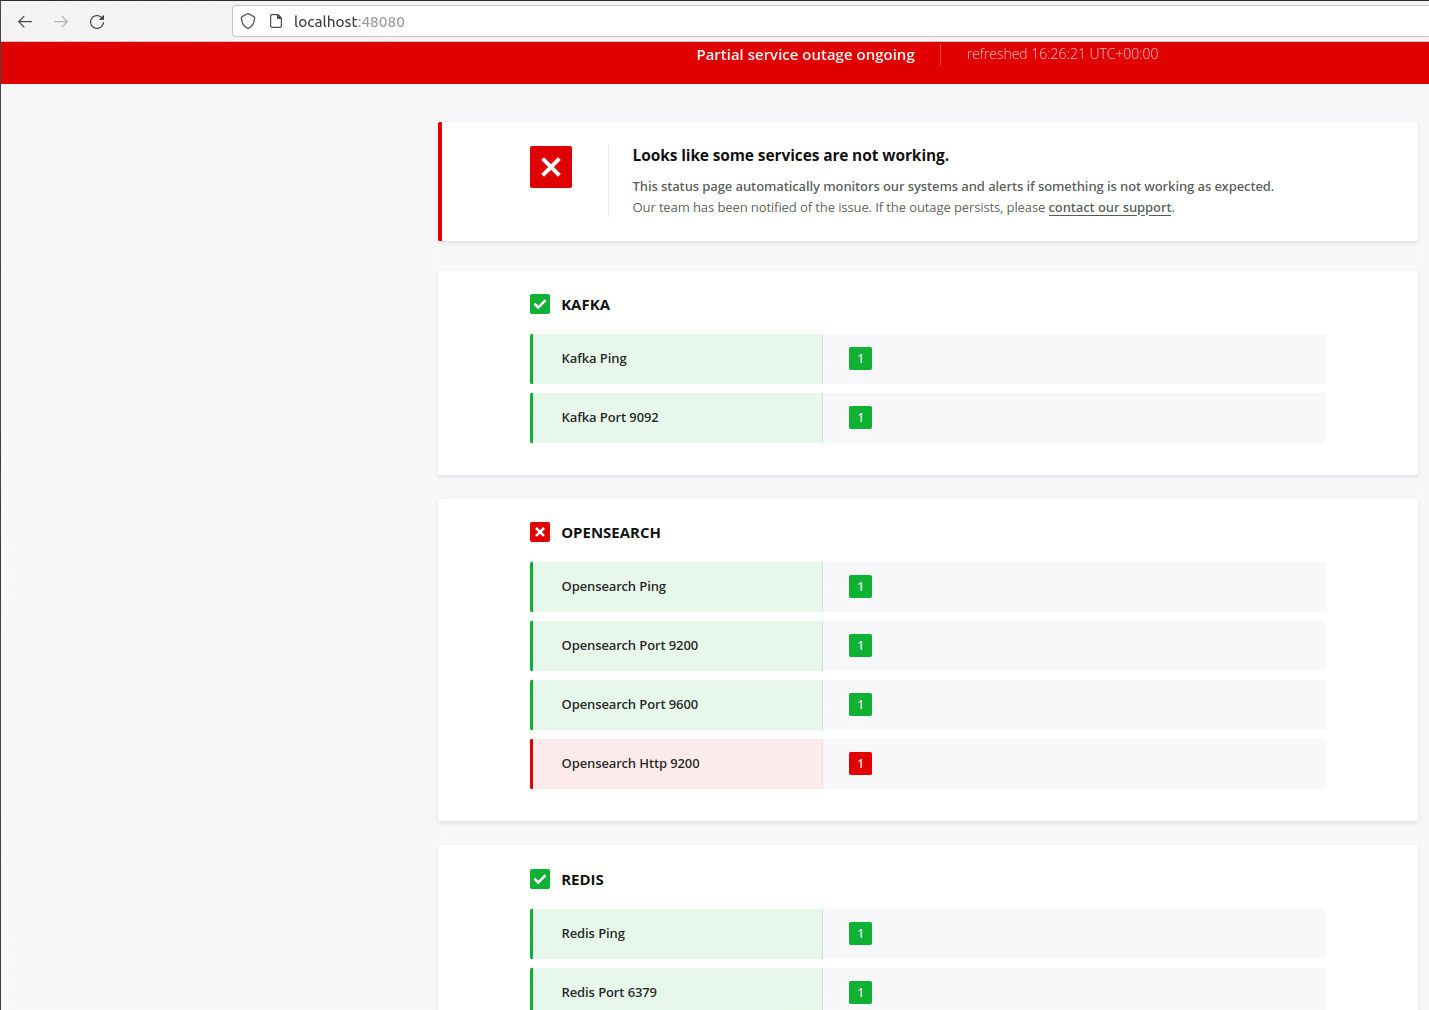
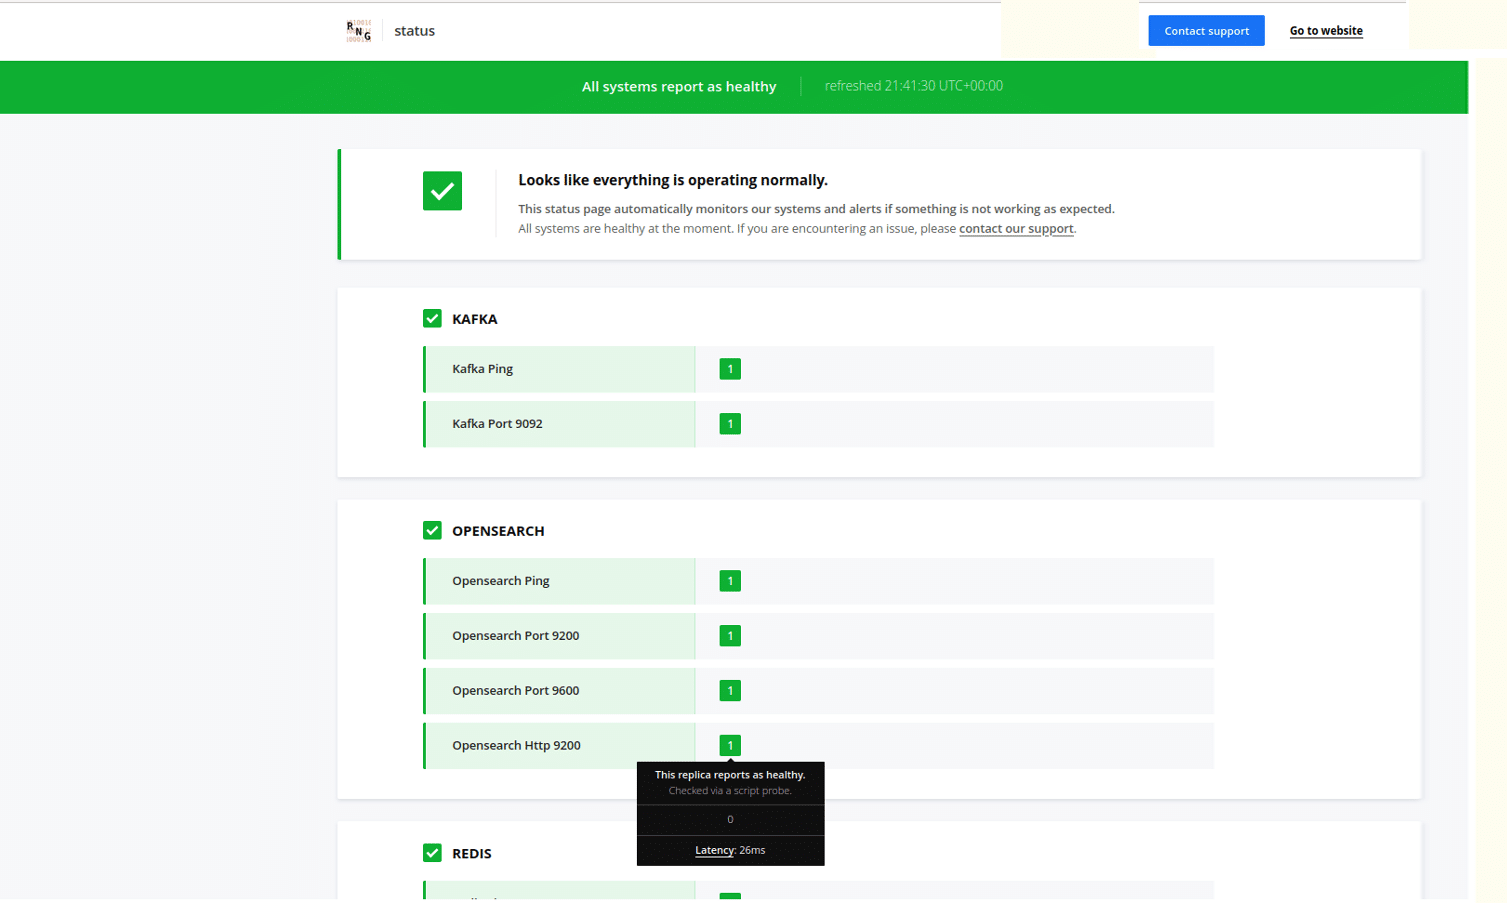
You can see how user-friendly and interactive the status page looks to help you instantly figure out where the probes are passing or failing. The tool tips show the replica details as well on hovering the mouse if you add reveal_replica_name = true setting in every probe.service.node subsection. The Vigil status page enables you to add a large number of probe targets due to its vertical scrolling. Please note that the OpenSearch HTTP probe is failing here, as currently there is no way to turn off the SSL certificate through the config file. We can solve this issue by using the script probe provided by Vigil. We’ll just create an inline script making use of the curl command with a flag to skip SSL certificate checks. Let’s create a new image for Vigil using the following command:
docker build -f Dockerfile_VigilSSLCertIgnore . -t vigilsci:v1.27.0
…after creating Dockerfile_VigilSSLCertIgnore in the current working directory as shown below:
Dockerfile_VigilSSLCertIgnore

FROM valeriansaliou/vigil:v1.27.0

RUN apk --no-cache add curl
You also need to modify the vigil_stack.yml and config.cfg files as per the diffs shown below:
diff vigil_stack.yml

4c4

< image: valeriansaliou/vigil:${VGILTAG:-v1.27.0}

---

> image: vigilsci:${VGILTAG:-v1.27.0}

26a27

>

diff config.cfg


79c79

< mode = “poll”

---

> mode = “script”

81c81,86

< replicas = [“https://admin:admin@opensearch:9200”]

---

> scripts = [

> ‘’’

> /usr/bin/curl -k https://admin:admin@opensearch:9200

> return $?

> ‘’’

> ]
Now execute the Docker commands used previously to launch the Vigil service, copy the new Vigil config, and restart the Vigil service respectively. Voila, the script probe fixes the limitation of the HTTP probe as shown in Figure 7.
You can administer Vigil through its APIs as well to publish public announcements, manually report node metrics, etc. The Vigil GitHub project page has the information to help you make use of its Manager and Reporter HTTP APIs. There is also a related optional component known as Vigil Local in case you are looking to report the health of some local services on the Vigil status page. Last but not the least, you can make use of Vigil Reporter libs provided for various programming languages to actively submit health information to Vigil from your apps. All this information should be enough for you to make full use of Vigil’s capabilities to craft a powerful black box monitoring status page.
Having a reliable and cost-effective monitoring solution is essential for businesses of all sizes. This article explored two popular free and open source tools that enable IT teams to set up status pages for black box monitoring of their infrastructure. By leveraging these solutions, businesses can proactively detect and address issues before they impact operations. With just a running Docker engine, setting up these tools is simple. Implementing the right monitoring strategy ensures better system reliability, improved response times, and overall operational efficiency, making it a crucial investment for any technology-driven organisation.
In the next part in this series of articles, we will explore Statping-ng, another powerful open source tool for setting up status pages and monitoring your IT infrastructure. Stay tuned!


