





































Most enterprises are running AI in production without being able to see what it’s doing. Open source tools like OpenTelemetry, LangFuse, Grafana and Arize Phoenix bring real observability to LLM pipelines, agents, and inference at scale.
The 2026 full-stack is 10× more complex than 2005. Teams shipping on it are faster than ever. That’s not a paradox — it’s a pattern that has repeated every decade. Here’s what it actually shows us.
The invisible crisis in enterprise AI
Every enterprise running AI in production is managing something it cannot fully see. An RAG pipeline confidently answers a question, but the retrieved context is incorrect. An agentic workflow loops silently for 90 seconds before timing out. An LLM fine-tuned last quarter starts generating subtly degraded responses after a change to the prompt template. None of these failures triggers a 500 error. None show up in your APM dashboard. They are invisible — until they become expensive.
This is the defining challenge of production AI in 2026: the gap between deploying AI and operating it responsibly. We have mature playbooks for deploying microservices, databases, and APIs. We have Prometheus, Grafana, and distributed tracing baked into cloud-native stacks. But for LLM pipelines, agentic systems, and AI-powered products, most organisations are flying with instrumentation designed for a different era.
You cannot manage what you cannot measure. In AI systems, that axiom has a sharper edge: by the time a failure surfaces to users, it has usually been quietly degrading for days.
The good news is that the open source ecosystem has moved quickly. A new generation of observability tooling — built specifically for the probabilistic, token-consuming, prompt-driven nature of LLM applications — is now production-ready. The architecture to instrument, monitor, and govern production AI exists. The question is whether your organisation has built it.
| Tool / Project | Category | Role in AI observability stack |
| OpenTelemetry (OTel) | Observability | Universal instrumentation standard for traces, metrics, logs — backbone of any AI observability stack |
| Prometheus | Metrics | Time-series metrics store — captures LLM latency, token throughput, error rates, GPU utilisation |
| Grafana | Visualisation | Unified dashboards for metrics, logs, and traces — industry standard for observability UI and alerting |
| Grafana Loki | Logging | Log aggregation optimised for Kubernetes-native environments — low-cost, label-indexed log querying |
| Jaeger | Distributed tracing | End-to-end trace visualisation for LLM chains and agentic workflows — OpenTelemetry compatible |
| Tempo (Grafana) | Tracing backend | High-scale, cost-efficient trace storage integrated natively with Grafana and Loki |
| LangFuse | LLM observability | Purpose-built for LLM: prompt versioning, token cost tracking, eval scoring, session replay |
| OpenLLMetry | LLM instrumentation | OpenTelemetry-based SDK — auto-instruments LangChain, OpenAI, Anthropic, Hugging Face |
| Helicone (OSS) | LLM proxy + Obs | Reverse proxy for LLM APIs capturing latency, cost, errors with zero code change |
| Traceloop | LLM pipelines | Workflow-level observability for multi-step LLM chains; integrates with OTel and existing stacks |
| MLflow | ML/LLM lifecycle | Experiment tracking, model registry, and LLM run logging — strong for fine-tuning and eval pipelines |
| Evidently AI | Model monitoring | Data drift, model quality, and LLM output quality monitoring — real-time and batch evaluation |
| Arize Phoenix | LLM evaluation | Open source LLM observability — trace visualisation, retrieval evaluation, embedding drift detection |
| Vector Admin (OSS) | Vector DB obs | Observability layer for vector databases (Weaviate, Qdrant, Chroma, Pinecone) |
| Weaviate / Qdrant | Vector storage | Open source vector DBs — monitorable via Prometheus exporters for retrieval latency and index health |
| Alertmanager | Alerting | Prometheus-native alerting with routing, deduplication, and silencing — essential for SLA enforcement |
| OpenCost | Cost observability | Real-time Kubernetes cost monitoring — extended to track LLM inference cost per workload |
| LangSmith (OSS) | LLM tracing | LangChain-native chain-level trace capture and debugging; community version available |
Why traditional observability falls short for AI
Classic observability rests on three pillars: logs, metrics, and traces. These remain essential — but they were designed for deterministic systems. When a function call fails, it throws an exception. When a database query is slow, latency is measurable and reproducible. LLMs and AI pipelines break all three assumptions:
Non-deterministic outputs
The same prompt, same model, same temperature produces different outputs. Traditional pass/fail health checks have no meaning here.
Invisible quality degradation
A model can return a syntactically correct, plausible-sounding response that is factually wrong or contextually off. No error is thrown.
Complex multi-step execution
RAG pipelines, tool-calling agents, and orchestrated workflows involve dozens of chained calls — each a potential failure or degradation point.
Cost as a dimension of health
LLM consumption is metered by token. A misfire in prompt construction or unexpected model routing can 10x your inference bill in a matter of hours.
Prompt as a deployable artifact
When a prompt changes, behaviour changes — but unlike code, there is no compile-time error. Observability must correlate output quality with the prompt version.
Observability for AI is not an extension of APM (application performance monitoring) — it is a new discipline that requires new instrumentation primitives, new quality signals, and new feedback loops between production telemetry and model evaluation pipelines.
The open source imperative for AI observability
Vendor-native observability for AI is maturing — but it comes with lock-in, opaque pricing, and limited extensibility. When your LLM observability stack is built into your model provider’s console, you have observability only for that provider. Open source changes the equation on three axes:
Vendor neutrality
Instrument Anthropic, OpenAI, Mistral, locally-hosted Ollama models, and Hugging Face endpoints with the same stack — OpenLLMetry and OpenTelemetry abstract the differences.
Extensibility
Your AI system is unique. Open source tools let you extend instrumentation to custom retrieval pipelines, proprietary vector databases, and in-house orchestration frameworks.
Cost governance
Enterprise-grade observability platforms charge per seat, per event, or per GB. At LLM token volumes, proprietary observability costs can rival the inference spend itself. Open source shifts that cost to compute.
The most sophisticated AI observability stacks at hyperscalers and leading enterprises are open source at their core — OpenTelemetry for the data plane, Grafana for visualisation, and purpose-built LLM-native tools for the semantic layer.
| Best practice | Why it matters |
| Instrument at pipeline level, not just model level | LLM calls are one node in a chain — capture the full span tree: retrieval, pre/post-processing, routing |
| Set baseline SLOs before production | Define p95 latency, token-per-second throughput, and hallucination rate thresholds before go-live — not after incidents |
| Separate observability by persona | Ops teams need infra metrics (GPU, queue depth); product teams need behavioural metrics (prompt success rate, session quality) |
| Capture prompts and outputs selectively | Log full prompt/response pairs for debugging — apply sampling and PII scrubbing. Full capture at scale is cost-prohibitive and risky |
| Track cost as a first-class metric | Token consumption maps directly to cost — alert on token spikes, model drift, and unexpected routing to expensive models |
| Use semantic versioning for prompts | Treat prompts as deployable artifacts. Correlate observability data to specific prompt versions to isolate regressions |
| Build feedback loops from observability to eval | Failing traces should feed automated eval pipelines — close the loop between prod telemetry and model quality |
| Plan for multi-model and multi-provider visibility | Abstract instrumentation at the gateway layer (Helicone, OpenLLMetry) for unified visibility across all providers |
The open source observability landscape for AI
The tooling landscape splits into two layers: the foundational observability infrastructure — largely inherited from cloud-native — and the LLM-native semantic layer built specifically for AI workloads.
Foundational layer: Cloud-native observability
OpenTelemetry (OTel) is the gravitational centre — the CNCF standard for telemetry and a vendor-neutral SDK for capturing traces, metrics, and logs across any language or framework. For AI observability, OTel serves as the transport layer: every tool in the LLM-native layer either exports to OTel or is built on top of it. Prometheus handles metrics storage and alerting. Grafana provides unified dashboards. Loki aggregates logs. Jaeger and Tempo handle distributed traces.
LLM-native semantic layer
LangFuse is the standout open source platform for LLM observability — providing prompt versioning, session tracing, token cost attribution, eval score capture, and a replay interface for debugging production failures. OpenLLMetry bridges the two worlds: it auto-instruments LangChain, OpenAI, Anthropic, and others — emitting OTel-compatible spans so LLM traces flow into your existing Jaeger or Tempo backend. Arize Phoenix, Evidently AI, and MLflow address evaluation and drift detection — closing the feedback loop between production telemetry and model quality assessment.
Reference architecture: AI observability stack
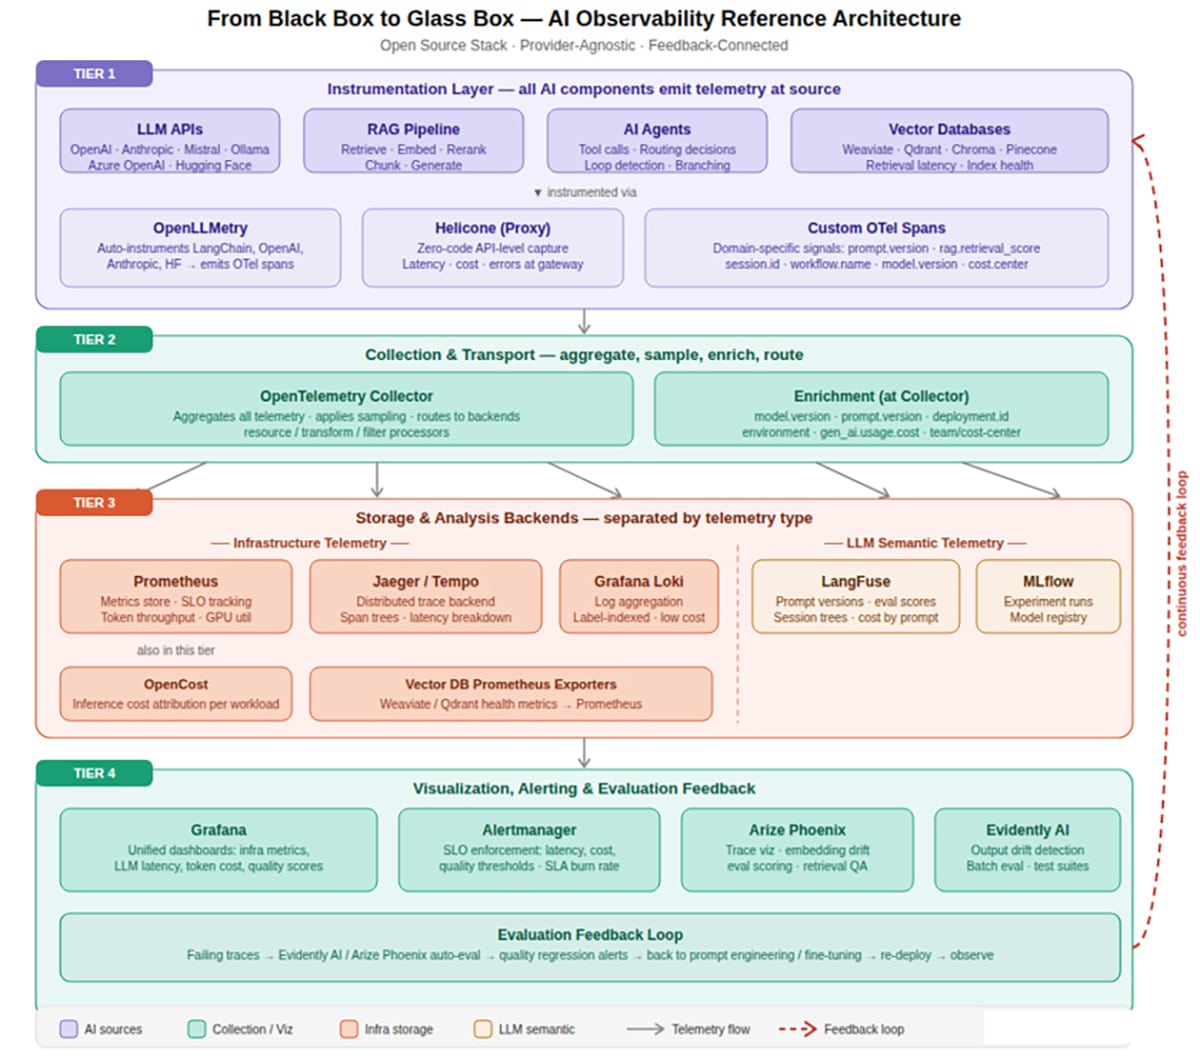
The architecture in Figure 1 shows a production-grade, open source AI observability stack structured across four logical tiers — provider-agnostic, pipeline-aware, and feedback-connected. It treats observability as a first-class architectural concern, not a bolt-on monitoring afterthought.
Tier 1 — Instrumentation
Every AI component is instrumented at source: LLM API calls, vector database queries, retrieval steps, tool invocations, and orchestration decisions. OpenLLMetry provides auto-instrumentation for major LLM frameworks. Custom spans capture domain-specific events such as RAG relevance scores and agent decision branches. Helicone or a custom OTel-enabled reverse proxy captures API-level telemetry without code changes in legacy services.
Tier 2 — Collection and transport
The OTel Collector aggregates telemetry from all sources, applies sampling strategies, enriches spans with environment metadata (model version, prompt version, deployment region, cost attribution), and routes to backend stores. This tier decouples instrumentation from storage — a critical design choice that lets you swap backends without touching application code.
Tier 3 — Storage and analysis backends
Traces route to Tempo or Jaeger. Metrics go to Prometheus. Logs land in Loki. LLM-specific semantic data — prompt/response pairs, eval scores, session trees — is stored in LangFuse’s PostgreSQL-backed store. This separation of concerns is intentional: infrastructure telemetry and LLM semantic telemetry have different retention, query, and governance requirements.
Tier 4 — Visualisation, alerting, and feedback
Grafana provides the unified observability interface — dashboards spanning infrastructure metrics, LLM latency, token costs, and quality scores. Alertmanager enforces SLOs. Arize Phoenix and Evidently AI power the evaluation feedback loop — taking production traces, running automated quality scoring and drift detection, and routing failures back to prompt engineering or fine-tuning workflows. This tier is where observability becomes a continuous improvement engine.
Best practices for enterprise AI observability
Getting the tooling in place is the easy part. Operating it well — at enterprise scale, with governance requirements, across multiple AI products — requires deliberate architectural decisions:
| Use case | Problem without observability | How open source solves it |
| RAG pipeline quality | Retrieval quality degrades silently as data changes | Trace retrieval latency, chunk relevance scores, and context token usage using OpenLLMetry + Arize Phoenix |
| Agentic workflow debugging | Multi-step agents fail non-obviously — wrong tool selection, infinite loops, silent errors | Full span traces per agent run (Jaeger/Tempo), tool call success/failure metrics, loop detection via trace depth alerts |
| Multi-model cost governance | Multiple LLMs across teams create uncontrolled spend with no attribution | Token consumption dashboards (Grafana + Prometheus), cost-per-workflow alerting, model routing efficiency via OpenCost |
| Hallucination and drift detection | Output quality degrades over time as prompts age or models update | Evidently AI for output drift detection; LangFuse for eval scoring; alert when quality metrics fall below SLO thresholds |
| LLM SLA enforcement | SLAs are now expected for AI features — requires observability infrastructure | Prometheus + Alertmanager for p95 latency SLOs; Grafana dashboards for real-time SLA burn rate tracking |
| Security and compliance auditing | AI systems subject to audit — prompt logs and output histories must be captured and governed | Structured logging via Loki with access controls; retention policies aligned to compliance requirements (GDPR, HIPAA) |
| Fine-tuning and experiment tracking | Without tracking, fine-tuning runs are unreproducible — no ability to correlate model version to prod behaviour | MLflow for experiment logging; link model registry entries to production observability dashboards |
Top use cases: Where observability changes outcomes
Observability is not an IT concern — it is a business risk management capability. The following use cases illustrate where the absence of AI observability creates material business risks, and how open source tooling addresses it.
Observability is the discipline that makes AI trustworthy
We are at an inflection point. The first wave of enterprise AI was about proving it works. The second wave — the one most organisations are entering now — is about making it reliable, governable, and trustworthy enough to run in mission-critical contexts. That transition cannot happen without observability.
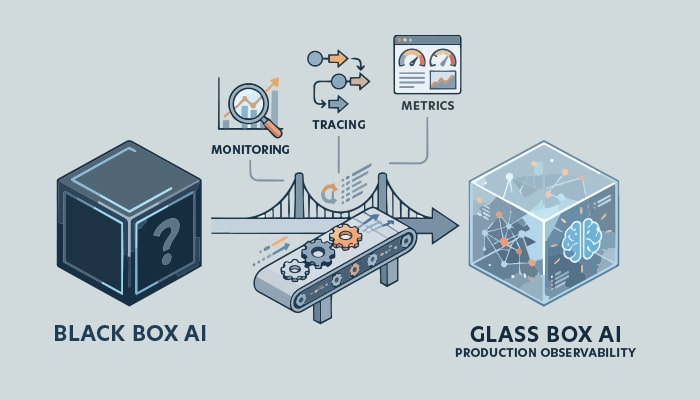
The shift from black box to glass box is not primarily a tooling challenge — the open source ecosystem has solved that. It is an architectural commitment: to instrument pipelines before they go to production, to define quality SLOs alongside latency SLOs, to build feedback loops from production telemetry into evaluation pipelines, and to treat prompts as versioned artifacts with observable lifecycles.
Organisations that build this capability now will have a structural advantage. They will catch degradation before users do. They will govern costs before they spiral. They will debug in hours rather than days. And they will have audit trails, quality histories, and model performance data that regulators and auditors are increasingly requiring.
The most important architectural decision you can make for your AI investments in 2026 is not which model to run. It is whether you can see what it is doing once it is running.
Disclaimer: The opinions expressed in this article are the author’s and do not reflect the views of the organisation he works in