Observability helps teams detect failures and gain a deep understanding of their root causes. This simplifies debugging while improving systems performance and reliability. Modern DevOps benefits greatly from open source observability tools.
In the past, IT teams depended on monitoring systems to check system functionality. Monitoring tools generated alerts when system failures occurred, such as server crashes or high CPU usage. These tools allowed users to track basic system metrics such as memory utilisation, system errors or system load. This approach worked well when applications were simple and ran on a few servers.
But modern systems are much more complex. The current technology landscape employs microservices together with containers and cloud platforms. Many applications are now built using microservices architecture, where each feature like user login, payment processing, or order tracking is handled by its own independent service. These microservices exchange information through APIs while operating from different servers and containers across multiple cloud provider platforms. For example, in an ecommerce application, the product catalogue may run on AWS, the payment service on Azure, and the customer support chatbot may run on-premises. These different system components need to function together to provide users with a seamless experience. Such complex systems require more than a fundamental understanding of system failures. We need to know what broke, where it broke, and why it broke.
The solution to this problem is observability. Observability extends beyond traditional monitoring capabilities by enabling teams to understand what’s happening inside complex systems even when unexpected issues occur. It uses logs, metrics and traces to deliver complete insights on system behaviour.
Observability functions as a control room in the fast-moving DevOps environments that experience continuous software changes. It helps teams to detect the root causes of problems so they can resolve them swiftly while developing more reliable systems. Observability provides teams with clarity and confidence. Without it, teams lack a clear direction.
The anatomy of observability
At its heart, observability is about making sense of what’s happening inside a system by analysing output data. This concept originated from control theory. It became very important in software engineering as systems became more distributed and dynamic, and it became challenging to manage them with conventional methods.
The three primary forms of telemetry data that build observability include logs, metrics and traces. The combined data enables teams to monitor their systems, detect issues and analyse behaviours during unexpected problems.
The system generates logs that maintain detailed records of its operational events. These logs contain error messages, API calls or records of user login attempts. The system health and performance trends become visible to users through these logs. Open source tools like Fluentd, Logstash and Grafana Loki serve as popular solutions for log collection, processing, and search functionality across multiple services and environments.
Metrics are numerical values that measure performance over time. Common system performance metrics include CPU usage, request latency and active user sessions. Prometheus stands as the leading open source platform to retrieve and analyse metrics and is paired with Grafana for interactive dashboard development.
Traces track the path of a request as it moves through different parts of an application. Microservices-based systems benefit from tracing because it helps developers to identify slowdowns and failures across multiple services. This is especially helpful when one user action may touch several services. Jaeger and Zipkin are leading open source tools that deliver robust distributed tracing solutions to users.
Each of these components tells a part of the story. But when used together, they form a complete picture (Table 1).
Table 1: Core observability data types
| Data type | Description | Tools |
| Logs | Detailed event records | Fluentd, Logstash, Grafana Loki |
| Metrics | Numerical performance data | Prometheus |
| Traces | Request flow tracking | Jaeger, Zipkin |
Observability vs monitoring: What’s the difference?
The terms monitoring and observability are often confused, but they are distinct concepts. Both maintain system health but operate differently because they serve different needs in complex modern applications.
The main goal of monitoring is tracking known problems. You establish tracking parameters such as CPU usage, memory and error rates, and configure alert systems to trigger when thresholds are exceeded. The system functions effectively when you understand what constitutes a failure. A monitoring system such as Nagios, Zabbix or Prometheus (also used for observability) will alert you when a server crashes or CPU usage exceeds a certain threshold. Monitoring systems identify system problems, but they do not provide explanations about their causes.
Observability goes deeper. The system provides the necessary tools to investigate unexplained issues. The combination of logs, metrics and traces helps to understand the internal behaviour of the system, especially during unexpected failures. Tools such as Grafana, Jaeger, Loki and OpenTelemetry enable users to track how individual user requests move between multiple services. Observability provides complete visibility into system operations beyond individual metrics or alert notifications.
Think of monitoring like a car’s dashboard — it shows speed, fuel in the car, and gives engine warnings. Observability is more like having access to a mechanic’s full diagnostic toolkit. The diagnostic equipment of a mechanic provides a far more comprehensive view than what monitoring tools offer. The system enables you to detect hidden problems, which you would not have looked for otherwise.
Monitoring functions as an alert system, which notifies users about system problems. Observability functions as an investigative tool that reveals the root causes of system failures and their initial points of origin.
Both are essential. System stability depends on monitoring, while observability gives an insight and helps improve the capabilities of systems during fast scaling or complex debugging situations. Open source tools offer cost-effective monitoring and observability solutions that can also be customised.
The open source observability landscape
Open source tools function as the fundamental building blocks for modern observability stacks. They are powerful, cost-effective and backed by strong communities. Most DevOps teams have adopted open source tools as their primary solution for application monitoring and debugging, as well as performance enhancement.
Prometheus is one of the leading tools. It is well known for metrics collection and querying, and performs best in Kubernetes environments. Through its real-time alert functionality Prometheus enables teams to quickly identify and manage system health problems.
Grafana uses Prometheus data to generate interactive dashboards that make complex data more understandable. The tool supports multiple data sources beyond Prometheus. This makes it adaptable for displaying logs, metrics and traces.
Logging tools like Loki and Fluentd are frequently used by organisations. Loki operates as an efficient solution that integrates seamlessly with Grafana. The log data collection and routing capabilities of Fluentd make it an excellent choice for containerised environments.
The distributed tracing tools Jaeger (created by Uber) and Zipkin are widely used by developers. These tools help teams track request flows between services. This enables better identification of system bottlenecks and failures in complex systems.
OpenTelemetry is new and is being adopted rapidly because it provides a unified standard for metrics, logs and traces. Major technology companies are backing this project, helping it turn into a fundamental component of open source observability infrastructure.
Teams can achieve complete system visibility by combining these tools without the need for costly proprietary solutions (Table 2).
Table 2: Open source observability tools
| Tool | Purpose | Notable features |
| Prometheus | Metrics collection and alerting | CNCF project; great with Kubernetes |
| Grafana | Visualisation | Supports multiple data sources; rich dashboards |
| Loki | Log aggregation | Built by Grafana Labs; lightweight and scalable |
| Fluentd | Log collection and routing | Works well in cloud-native and container setups |
| Jaeger | Distributed tracing | Open source from Uber; scalable for microservices |
| Zipkin | Distributed tracing | Lightweight; simple setup |
| OpenTelemetry | Unified data collection (metrics, logs, traces) | Vendor-neutral, fast growing CNCF (Cloud Native Computing Foundation) project |
Observability in CI/CD pipelines
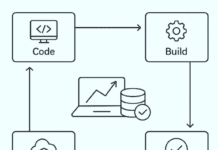
The present DevOps environment eliminates traditional software development cycles that span from coding to release over extended periods. Cloud platforms, together with agile practices, enable organisations to deploy updates multiple times throughout each day. The fast deployment of new code becomes possible through continuous integration and continuous deployment (CI/CD), which automate testing and release processes.
This fast pace of operations creates new security challenges. A minor bug that crept in during morning development could potentially reach production systems before the lunch break. Observability is an absolute necessity here because it serves as the essential protective mechanism. It provides much needed visibility to teams, which enables them to detect problems early and understand their source before users experience any negative effects.
The CI/CD pipeline receives complete support from observability throughout its operational sequence. In the integration phase, logs and metrics from test environments reveal failing components or performance dips long before code reaches production. Real-time metrics and traces help track how the system behaves when a new version is tested on a small group of users, called a canary deployment. They also monitor the system during the full release. The system can stop or reverse a release immediately when error rates increase or response times become slow.
Once changes are live, observability shifts its focus to how real users are experiencing the system. Tracing tools enable users to track the complete journey of failing requests, which helps identify the faulty update service or configuration.
Open source solutions power much of this visibility. Prometheus tracks performance metrics, Grafana turns them into interactive dashboards and Jaeger provides deep distributed tracing. These tools enable teams to maintain quick development speeds while maintaining complete control of their operations.
Observability in high velocity delivery environments creates trust by providing more than disaster prevention capabilities (Table 3).
Table 3: Observability in CI/CD pipelines
| Pipeline phase | Role of observability | Benefits |
| Integration | Logs and metrics reveal failing tests | Early detection of issues |
| Deployment | Real-time metrics and traces monitor rollout | Immediate rollback on failure |
| Production | Tracing tracks user request flows | Pinpoints faulty updates or configs |
Challenges and trade-offs in observability
Observability gives teams a clear window into complex systems. But that clarity comes with challenges. The first and most common is data overload. Every part of a system, such as servers, services and applications, can produce logs, metrics and traces. In a microservices setup with dozens or even hundreds of services, this can mean millions of data points every hour. Even with open source tools, storing and processing all this information can be expensive. For example, if a company records every API request and trace detail using Prometheus and Loki, the storage costs for just a few weeks of data can grow quickly.
Another challenge is tool fragmentation. Many teams use one tool for metrics, another for logs and a third for traces. One may be using Prometheus to track performance, Fluentd or Loki to handle log data, and Jaeger may follow request flows. When these tools do not integrate well, it becomes harder to follow a problem from start to finish. This slows down troubleshooting and can frustrate engineers. To address this, many teams are turning to OpenTelemetry, as it collects metrics, logs and traces in a single unified way.
Cost management is another trade-off. The free nature of open source tools does not translate to free operation at large scale. Servers, storage and network resources all add up. Teams manage costs by filtering out unneeded logs, sampling portions of data, and setting up storage duration restrictions.
Finally, there is a skills gap. Not every engineer is comfortable reading trace graphs, writing complex queries or building custom dashboards. The solution to this challenge demands training programmes, a simple dashboard design for all team members, and user-friendly observability tools.
When managed well, observability remains a powerful asset rather than an overwhelming burden.
The future: AIOps and automated remediation
Observability tools now serve beyond their traditional role of detecting problems. They predict system issues early and start to fix them before they cause operational disruptions thanks to AIOps technology (artificial intelligence for IT operations). Observability tools collect vast amounts of data, which AIOps processes through machine learning algorithms to identify potential problems.
AIOps systems detect patterns of memory usage reaching specific levels to anticipate service crashes before failures occur. The system detects problems ahead of time so it can both notify users and automatically restart services. Over time, it learns what ‘normal’ looks like for your system and quickly flags anything unusual, sometimes before users even notice.
Open source developers are currently exploring this area. The Keptn project develops automated remediation workflows for Kubernetes, which enables systems to initiate responses to failures without human involvement. Grafana plugins now include AI-powered anomaly detection capabilities that enhance both speed and accuracy of problem identification while reducing false alarm occurrences. The current developments point towards a future system that automates diagnosis and real-time responses.
However, technology is only half the story. True observability depends just as much on team culture as it does on tools. The system functions optimally when developers work alongside testers and operations staff to share responsibilities in maintaining system health. Writing better logs, asking smarter questions, and learning from past incidents should be part of everyday work.
Observability functions as the DevOps nervous system because it continuously monitors system activities to detect threats and trigger immediate efficient responses. As open source tools and AIOps systems become more sophisticated, teams that integrate observability principles throughout their development process will be the most successful.


