


OpenSearch offers a robust and affordable anomaly detection solution. This fully open source and extensible platform incorporates machine learning capabilities straight into the operational data pipeline.
The scale, complexity, and velocity of contemporary IT infrastructures lead to a few challenges when using traditional DevOps methods. By incorporating artificial intelligence and machine learning into operations, AI-powered DevOps (AIOps) makes proactive monitoring, intelligent alerting, and autonomous remediation possible. An essential component of this ecosystem is the OpenSearch anomaly detection tool, which offers an open source, machine learning-based method for detecting anomalies in operational data in real time.
The role of AIOps
IT systems in the digital age are producing enormous volumes of data every second, ranging from events and logs to metrics and traces. Manually maintaining such systems is unsustainable and ineffective. Artificial intelligence for IT operations, or AIOps, automates and improves IT operations by using AI and machine learning, facilitating quicker problem identification, diagnosis, and resolution.
Conventional IT monitoring tools are reactive, static, and rule based. As organisations adopt microservices, containers, hybrid cloud, and edge computing, IT environments have become complex, volatile and large. Intelligence, automation, and scalability are provided by AIOps to manage these environments.
Overview of OpenSearch
Originally based on Elasticsearch, OpenSearch is an open source platform for search, analytics, and observability. Maintained by the OpenSearch Project, which is headed by Amazon, it has been built to manage application performance monitoring (APM), full-text search, and log analytics. AIOps functions are supported by OpenSearch’s machine learning (ML) plugins and observability features, especially for log-based anomaly identification, metrics analytics, and alerting.
Table 1: Core AIOPs features in OpenSearch
| Feature | Description | Plugin |
| Monitoring | Visualisations of logs/metrics, Dashboards | OpenSearch Dashboards |
| Predictive insights | Trend detection via time series machine learning models | ML Commons |
| Anomaly detection | Real time machine learning models for anomaly detection | ML Commons |
| Log ingestion |
Log parsing from various sources | Data Prepper |
| Alerting | Provides triggers on various anomalies- related events |
Alerting plugin |
The main advantages of this tool are:
- It is open source and free to use.
- Provides easy integration with ELK Stack (Elasticsearch, Logstash, Kibana, Beats) tools, and is fully compatible with Logstash and Beats.
- It has a built-in ML engine with the RCF (Random Cut Forest) algorithm.
- Its enhanced multi-variate anomaly detection capability helps detect data drift and unusual patterns automatically.
OpenSearch for anomaly detection
Large scale system monitoring can be done automatically and in real time with OpenSearch’s integrated, AI-driven anomaly detection. Figure 1 describes the core components of the tool that can be used for anomaly detection.
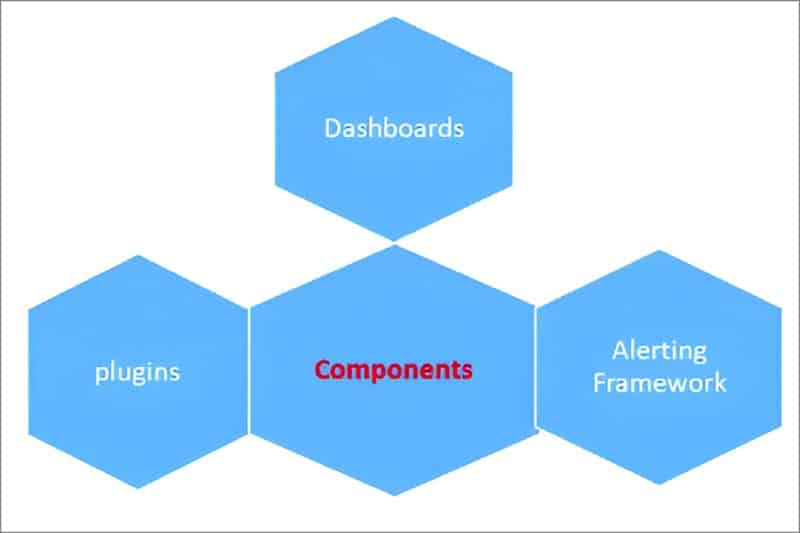
Plugins: A core plugin in OpenSearch is used to detect anomalies in time-series data using unsupervised machine learning. It uses a lightweight Random Cut Forest algorithm, which identifies data points that are far from the usual data points. This plugin has a multi-entity detection utility, which detects anomalies per host, service, etc, in real time. It uses REST API and UI-based management via dashboards, which visualise anomalies in an efficient way.
An index management plugin manages the data life cycle of indexes used for anomaly detection. This plugin defines policies for index rollover, retention, deletion, etc. It prevents storage bloat from continuous anomaly logging.
A performance analyser plugin is very helpful in anomaly root cause analysis. It analyses system level performance metrics, and correlates performance degradation with detected anomalies.
Dashboards: An online user interface tool called OpenSearch Dashboards lets you examine, view, and evaluate data kept in OpenSearch clusters. It is an OpenSearch Project fork of Kibana 7.10.2. Through user-friendly dashboards, charts, graphs, and plugins, it contributes significantly to security, monitoring, anomaly detection, and DevOps observability. The Anomaly Detection Dashboard offers a complete interface for controlling detectors and keeping an eye on any odd activity in data streams (Table 2).
Table 2: Various components of the Anomaly Detection Dashboard
| Component | Description |
| Detector list | This list comprises ‘View Status’ and ‘Type’. |
| Detector details view | This view comprises:
|
| Configuration panel | This has functionalities such as set features to monitor, define aggregation, choose detector interval, and delay and set filters for multivariate detection. |
| Linked visualisations | This helps to link anomaly results to external dashboards. |
Alerting framework: The alerting plugin in OpenSearch is a powerful tool used to monitor your data and trigger actions when specific conditions are met. It makes it possible to receive real-time alerts about your metrics, logs, and anomaly detection findings. You may set up Monitors, Triggers, and Actions to alert you or automate corrective action when thresholds are exceeded or patterns are found.
The core concepts of the OpenSearch alerting framework are:
- Monitor: Specifies which data to monitor and how frequently. It runs a query or keeps an eye on an anomaly detector.
- Trigger: A condition (e.g., value exceeds threshold) within the monitor that specifies what to look for.
- Action: It indicates how to respond when a trigger is triggered (send a webhook, Slack message, email, etc).
- Destination: It is a reusable notification channel.
Table 3 compares OpenSearch with the well-known ELK Stack and Prometheus+Grafana tools.
Table 3: Comparing OpenSearch with other popular tools
| Parameter | OpenSearch | ELK Stack | Prometheus+Grafana |
| Type of tool | Open source | Commercial+OSS | Open source |
| AIOps focus | Medium | Medium to high | Low |
| Anomaly detection | Built-in via plugin (RCF) | Machine learning module; subscription based |
It supports only basic alerting |
| Multi-entity detection | Supported | Subscription based | Not supported |
| Alerting | Built in facility, which is pluggable. | It has a facility in the form of Watcher, which is subscription based | It contains basic rules only for alerting |
| Cost | Free | Machine learning requires subscription | Free |
| Custom ML models | Via ML Commons plugin | Subscription based | Not supported |
Real-time anomaly detection is essential for maintaining system stability, reducing downtime, and proactively resolving performance issues in the quickly changing field of AI-powered DevOps (AIOps). OpenSearch allows for unsupervised anomaly identification on time-series data without the need for intricate external setups because of its inbuilt support for Random Cut Forest (RCF) algorithms. Both small- and large-scale DevOps settings can benefit greatly from its smooth interface with security plugins, visual dashboards, and alerting systems. Compared to other tools such as the ELK Stack and Prometheus+Grafana, OpenSearch stands out for its openness, flexibility, built-in anomaly detection, and support for multi-entity models — all of which are essential for AIOps strategies.


