
This article introduces the time series database, InfluxDB, which is an open source application written in the Go programming language. InfluxDB is easy to use, scalable and highly available.
A time series database is used to store log, sensor and other data, over a period of time. With the arrival of the Internet of Things (IoT), one needs to log events across multiple applications. A time series database is uniquely positioned to solve the challenges of millions of events coming in, which you need to filter and analyse.
This article shows readers how to set up InfluxDB on Windows. It will also demonstrate how data can be inserted into InfluxDB, how to perform basic queries and look at the REST API that it exposes.
The TICK stack
InfluxData, the company behind InfluxDB, provides a platform known as the TICK stack. This is a comprehensive platform to collect, store, analyse and visualise time series data. The TICK stack comprises Telegraf, InfluxDB, Chronograph and Kapacitor. In this article, we are going to concentrate on the core product, InfluxDB, which is used to store and query the time series database.
The above products are all free to download and use. They are open source projects (MIT Licence) but, at the same time, InfluxData provides commercial versions of the products, which come with full support and additional enterprise features that are chargeable.
Installation
InfluxDB is available on all major platforms including Windows. The product is packaged as a set of binaries that you can run on Windows. The best part of this is that the binaries have all the required dependencies built-in. So you do not need any other dependencies to be installed on Windows to run the InfluxDB software.
To install the product, currently at 1.0.0, visit the following URL in the browser, or you could do a wget in Powershell for the URL below to download the Zip file.
The next step is to simply unzip the file in a folder of your choice. For example, when we unzip the above folder in the root drive (say C:\), we get the following folder and executables:
C:\>dir influxdb-1.0.0-1
 Volume in drive C is OS
 Volume Serial Number is AC69-784D

 Directory of C:\influxdb-1.0.0-1

09/07/2016  06:50 PM    <DIR>          .
09/07/2016  06:50 PM    <DIR>          ..
09/07/2016  06:50 PM         8,657,920 influx.exe
09/07/2016  06:50 PM        20,148,224 influxd.exe
09/07/2016  06:50 PM             9,825 influxdb.conf
09/07/2016  06:50 PM         8,818,688 influx_inspect.exe
09/07/2016  06:50 PM        11,308,032 influx_stress.exe
09/07/2016  06:50 PM        15,068,672 influx_tsm.exe
               6 File(s)     64,011,361 bytes
Starting the InfluxDB server
The InfluxDB service is the executable file named influxd.exe. It comes with a default configuration file named influxdb.conf, which we will use while starting the server.
To start the server, execute the influxd.exe file with the run command and pass the configuration file that is shipped as shown below. You could just launch the executable too and, by default, it will execute the run command and use the default configuration file, but it is good practice to provide the configuration file as shown below:
C:\influxdb-1.0.0-1>influxd run --config c:\influxdb-1.0.0-1\
influxdb.conf
...........
[run] 2016/10/02 11:30:20 InfluxDB starting,
version 1.0.0, branch master, commit
37992377a55fbc138b2c01edd4deffed64b53989
[run] 2016/10/02 11:30:20 Go version go1.6.2, GOMAXPROCS set
to 4
[run] 2016/10/02 11:30:20 Using configuration at: c:\
influxdb-1.0.0-1\influxdb.conf
……
Rest of the output
Leave this process running since this is the daemon that will accept requests to insert the data into the database, either from the command line or via the REST API interface that it exposes.
Creating our database
Now that we have our InfluxDB service up and running, the next thing to do is to create our database. You can have multiple datasets (databases) in your InfluxDB installation, which can each be managed separately.
InfluxDB ships with a neat utility named influx.exe, which you will find in your installation directory. This is the client console program, also known as the InfluxDB shell that you will use to talk to the InfluxDB server that we started in the previous section. It works on lines similar to popular database clients, where you can connect to database instances, perform both DDL and DML like operations, and more. If you are familiar with the MySQL client program, this will feel very similar to that.
To launch the InfluxDB client, open another command prompt and navigate to your installation directory. Execute the influx.exe application without any parameters, as shown below:
C:\influxdb-1.0.0-1>influx.exe

Visit https://enterprise.influxdata.com to register for updates, InfluxDB server management, and monitoring.

Connected to http://localhost:8086 version 1.0.0
InfluxDB shell version: 1.0.0
>
Note that we did not specify any parameters, as a result of which the client connects to the InfluxDB daemon running on the localhost. Alternatively, you can provide multiple other parameters like –host, –port, etc, to connect to InfluxDB instances running on other host machines across the network, whether on your private network or a public network.
We will now create our database that will hold the time series data that we wish to capture. The sample scenario is that of an office, where we would like to capture two kinds of measurements — temperature and sound levels. You will soon see how you can push this data into the InfluxDB data, but for now, let us call this database OfficeMonitoringDB.
To create the database, give the following CREATE DATABASE <databasename> command in the InfluxDB client, as shown below:
> CREATE DATABASE OfficeMonitoringDB
> show databases
name: databases
---------------
name
_internal
OfficeMonitoringDB
>
The first command will create the database. We then execute another command to list the current databases that are present in this instance of InfluxDB. You can see that in addition to its internal database, it also has our newly created OfficeMonitoringDB database.
We can now use the DML statements to create some sample records for our reference. The first step is a standard step, to indicate to the client which specific database we will use for the INSERT statements that we will be firing in a while. This is done via the USE <databasename> command, as shown below:
> USE OfficeMonitoringDB
Using database OfficeMonitoringDB
>
We can now use INSERT statements to create sample records for our measurements (temperature and sound). The format for inserting a record is as follows:
<measurement>[,<tag-key>=<tag-value>..] <field-key>=<field-value>[,fields..] [unix-nano-timestamp]
Let us understand what the above format means.
First, the measurement is what we are capturing, i.e., temperature and sound, in our case.
Second, it can have one or more tag values, associated with the reading. For example, we can create a tag name OfficeName and provide its value. This will help us use the same database for capturing data across multiple offices and then query the data using the tag values.
Finally, we have one or more key/value pairs, which is the actual value of the measurement. For example, in the case of temperature, it could be value=23 (where 23 is the reading in degree Celsius) or for the sound measurement, it could be value=70 (where 70 is the reading in decibels).
Let us consider our office’s name as O1. We can now fire multiple INSERT statements for the temperature measurement as shown below, to simulate some data for our queries:
> INSERT temperature,officename=O1 value=23.1
> INSERT temperature,officename=O1 value=23.2
> INSERT temperature,officename=O1 value=23.1
> INSERT temperature,officename=O1 value=23.3
> INSERT temperature,officename=O1 value=23.2
Similarly, we can insert records for the sound measurement as shown below:
> INSERT sound,officename=O1 value=50.1
> INSERT sound,officename=O1 value=50.2
> INSERT sound,officename=O1 value=55
> INSERT sound,officename=O1 value=50.1
> INSERT sound,officename=O1 value=50.25
We can now fire standard SELECT statements to query our database too, as shown below:
> SELECT * FROM temperature
name: temperature
-----------------
time                                    officename      value
1475390293075674300     O1                  23.1
1475390298980348300     O1                  23.2
1475390300734637600     O1                  23.1
1475390302341035800     O1                  23.3
1475390304245307200     O1                  23.2

> SELECT * FROM sound
name: sound
-----------
time                                    officename      value
1475390867994939100     O1                  50.1
1475390870004235200     O1                  50.2
1475390872600605800     O1                  55
1475390876404970300     O1                  50.1
1475390879424646200     O1                  50.25
>
This is just a fraction of the capability of the InfluxDB DDL and DML statements. Take a look at this link for the entire specifications.
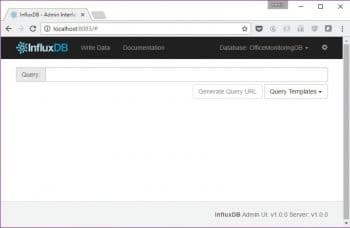
InfluxDB Web administration application
The InfluxDB database ships with a default Web application, which you can use to query the databases and also to write data into the database. The default Web server is running on port 8083 of your InfluxDB host machine. In our case it is localhost.
Launch a browser and visit http://localhost:8083. This will bring up the admin UI, as shown in Figure 1.
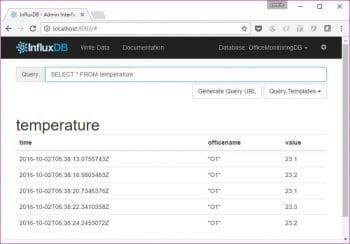
You can also execute any of the queries for your respective databases. In our case, we select the database OfficeMonitoringDB from the Database list at the top right, and then fire a SELECT statement as shown in Figure 2.
You will also notice a ‘Write Data’ option in the top menu that you can use to insert records in the database. This is similar to what we did earlier with the InfluxDB client application.
The REST API
InfluxDB exposes a REST API on port 8086. This API exposes three endpoints — /ping, /query and /write, and it is clear from their names that they can be used to monitor the temperature and sound if InfluxDB is up, and then either query or write data into the database. The REST API can be used by applications to insert data into the database. InfluxDB also ships with client libraries in multiple languages, which makes it easier for you to integrate it into your applications.
We can use the /query endpoint via the Curl utility to see the existing data that it returns for the temperature measurements that we currently have in our database:
curl -G ‘http://localhost:8086/query?pretty=true’ --data-urlencode “db=OfficeMonitoringDB” --data-urlencode “q=SELECT * FROM temperature WHERE officename=’O1’”

{
    “results”: [
        {
            “series”: [
                {
                    “name”: “temperature”,
                    “columns”: [
                        “time”,
                        “officename”,
                        “value”
                    ],
                    “values”: [
                        [
                            “2016-10-02T06:38:13.0756743Z”,
                            “O1”,
                            23.1
                        ],
                        [
                            “2016-10-02T06:38:18.9803483Z”,
                            “O1”,
                            23.2
                        ],
                        [
                            “2016-10-02T06:38:20.7346376Z”,
                            “O1”,
                            23.1
                        ],
                        [
                            “2016-10-02T06:38:22.3410358Z”,
                            “O1”,
                            23.3
                        ],
                        [
                            “2016-10-02T06:38:24.2453072Z”,
                            “O1”,
                            23.2
                        ]
                    ]
                }
            ]
        }
    ]
}
Similarly, the command to insert a new temperature measurement via the REST API is shown below:
curl -i -XPOST ‘http://localhost:8086/write?db=OfficeMonitoringDB’ --data-binary ‘temperature,officename=O1 value=23.8’
Time series databases have gained prominence in recent times due to the popularity of sensor-based IoT applications, monitoring applications and multiple other use cases that are a good fit for them. InfluxDB is a leading time series database that has seen significant traction and is known for its simplicity and ease of use, along with its ability to perform at scale. It supports a wide range of client libraries and has binaries that run across multiple operating systems and architecture, including ARM. If you are looking for a time series database for your project, give InfluxDB a try.







How to save influx db database into system and use this database when we reopen the application using c#