


Data is sacred in today’s world, and Python libraries like Lux make data analysis and visualisation so much easier.
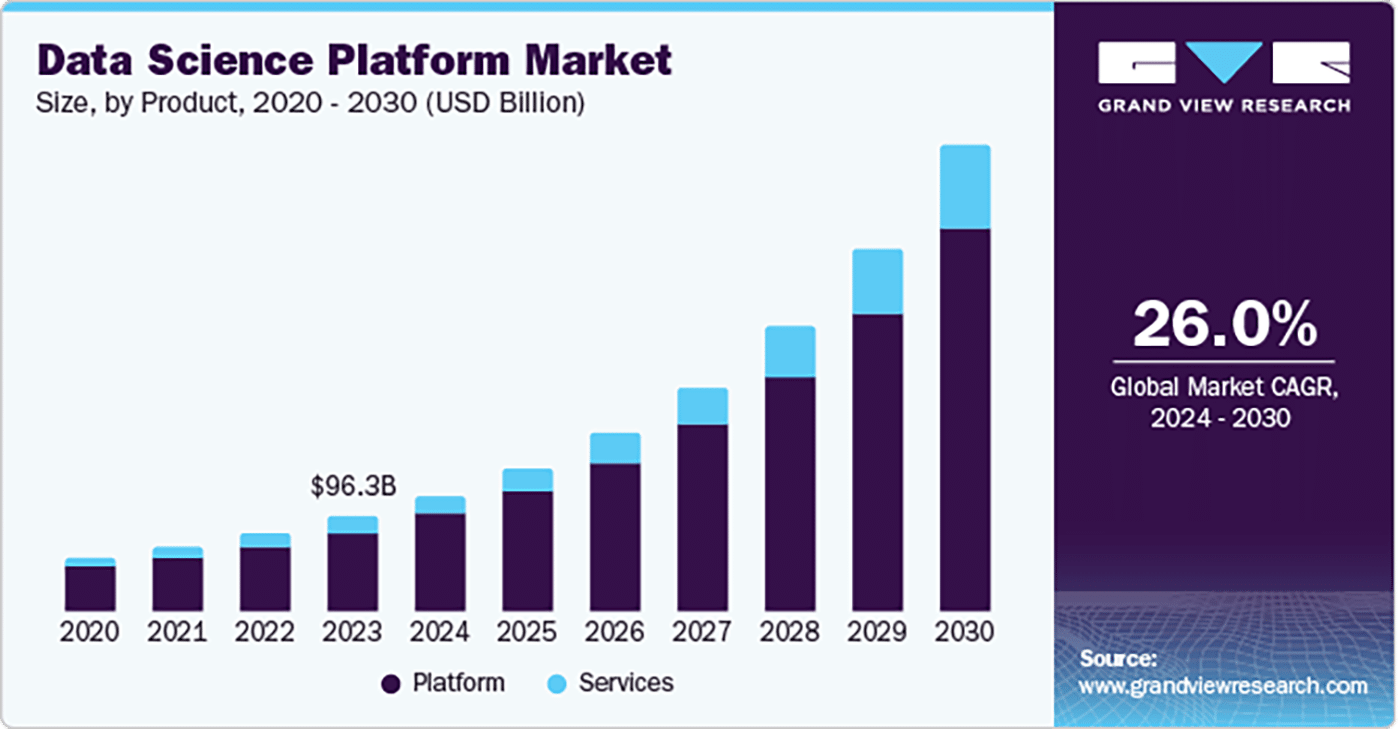
Data analytics and visualisation are key components of any real-world application. The analysis of historical data as well as predictive evaluations is crucial and helps organisations make strategic decisions. Hidden patterns that emerge as a result of data engineering help companies to evaluate customer feedback, customer leads, social media messages, e-commerce shopping patterns, and so on.
The applications and use cases of data engineering include predictive maintenance, customer segmentation, fraud detection, demand forecasting, sentiment analysis, recommender systems, speech recognition, image classification, autonomous vehicles, drug discovery, medical diagnosis, energy consumption prediction, supply chain optimisation, financial risk modelling, anomaly detection, natural language processing, smart city analytics, climate modelling, etc.
Table 1 lists the free and open source libraries for data analytics that can be programmed in different languages depending upon the use case and application.
| Library | Programming language | Implementation category | Key application segment |
| Lux | Python | Auto visualisation | Smart insights |
| Pandas | Python | Data wrangle | Tabular analysis |
| NumPy | Python | Numeric compute | Fast arrays |
| SciPy | Python | Scientific tools | Stats suite |
| Matplotlib | Python | Data plotting | Base charts |
| Seaborn | Python | Statistical plots | Pretty plots |
| Plotly | Python/JS | Interactive charts | Web visuals |
| Bokeh | Python | Interactive plots | Browser output |
| Altair | Python | Declarative visualisation | Grammar charts |
| scikit-learn | Python | Machine learning | ML models |
| TensorFlow | Python | Deep learning | Neural nets |
| PyTorch | Python | Deep learning | Research DL |
| Keras | Python | High-level DL | Easy neural |
| XGBoost | Python/R | Gradient boost | Boost trees |
| LightGBM | Python/R | Gradient boost | Fast trees |
| CatBoost | Python/R | Gradient boost | Categorical boost |
| Statsmodels | Python | Econometrics | Statistical tests |
| Dask | Python | Parallel compute | Scale Pandas |
| Vaex | Python | Large DataFrames | Out-of-core |
| Polars | Python/Rust | Fast DataFrames | Column engine |
| DuckDB | Multi-language | In-process SQL | OLAP query |
| Arrow | Multi-language | Column format | Memory spec |
| SQLite | C/Python | Embedded SQL | File DB |
| Apache Spark | Scala/Python | Big Data | Cluster compute |
| Apache Flink | Java/Scala | Stream engine | Realtime data |
| Hadoop MapReduce | Java | Batch engine | Distributed jobs |
| Hive | Java | SQL engine | Big SQL |
| Pig | Java | Data flows | Scripting ETL |
| Julia DataFrames | Julia | DataFrames | Tabular ops |
| Julia Stats | Julia | Statistics | Stats tools |
| Plots.jl | Julia | Data plotting | Multi-backend |
| R dplyr | R | Data wrangle | Tidy tools |
| R ggplot2 | R | Data plotting | Grammar graphics |
| R data.table | R | Fast tables | High-speed ops |
| R caret | R | Machine learning | ML suite |
| R Shiny | R | Web apps | Interactive dash |
| Weka | Java | Machine learning | Classic ML |
| Deeplearning4j | Java | Deep learning | JVM neural |
| RAPIDS cuDF | Python | GPU DataFrame | GPU Pandas |
| cuML | Python | GPU ML | GPU models |
| Orange | Python | Visual ML | GUI ML |
| KNIME | Java | Visual analytics | Drag workflow |
| Octave | Octave | Numeric compute | MATLAB-like |
| Scilab | Scilab | Numerical suite | Scientific tools |
| Gretl | C/GUI | Econometrics | Stats models |
| Giotto-tda | Python | Topological ML | TDA tools |
| MLJ.jl | Julia | Machine learning | Unified ML |
| Rust Polars | Rust | DataFrames | Fast column |
| Vega-Lite | JS | Declarative visualisation | JSON spec |
| D3.js | JS | Data visuals | SVG charts |
| Chart.js | JS | Web charts | Simple charts |
| Apache Superset | Python | BI dashboard | Web BI |
Table 1: Key libraries for data engineering, analytics and visualisation
Python offers a number of free and open source libraries that are dedicated to data visualisation and plotting. Table 2 lists these.
| Library | Output | Category | Key applications |
| Lux | Inline plots | Auto visualisation | Smart insights |
| Matplotlib | Static images | Base plotting | Core library |
| Seaborn | Static images | Statistical plots | Pretty charts |
| Plotly | Web plots | Interactive visualisation | Rich widgets |
| Bokeh | Browser output | Interactive plots | Dash ready |
| Altair | Web charts | Declarative visualisation | Grammar spec |
| Holoviews | Static/Interactive | High-level visualisation | Auto plots |
| hvPlot | Static/Interactive | Easy plots | Quick API |
| GeoPandas | Maps | Geo plots | GIS tools |
| Folium | Leaflet maps | Map visuals | Web maps |
| Cartopy | Static maps | Geospatial plots | GIS support |
| PyViz Panel | Web apps | Dashboarding | Multi-library |
| Dash | Web apps | Interactive apps | Plotly based |
| Pandas Plot | Static charts | Quick visualisation | Built-in API |
| Yellowbrick | Model plots | ML visualisation | ML diagnostics |
| Pygal | Vector output | SVG charts | Clean SVG |
| Pyecharts | Web charts | ECharts visualisation | China charts |
| VisPy | High-performance | GPU visualisation | OpenGL-based |
| Mayavi | Scientific 3D | 3D visualisation | VTK tools |
| Plotnine | Static images | Grammar charts | ggplot style |
| Datashader | Scalable visualisation | Large data | Huge datasets |
| K3D | Jupyter 3D | 3D plots | WebGL based |
| ipyvolume | Jupyter 3D | 3D widgets | Interactive 3D |
| PyVista | Static/Interactive | 3D models | Mesh tools |
| VTK | Scientific visualisation | 3D engine | Heavy duty |
| Manim | Vector video | Math animation | Animation library |
| Matplotx | Static images | Pretty themes | Style boost |
Table 2: Python-based libraries for data engineering and visualisation
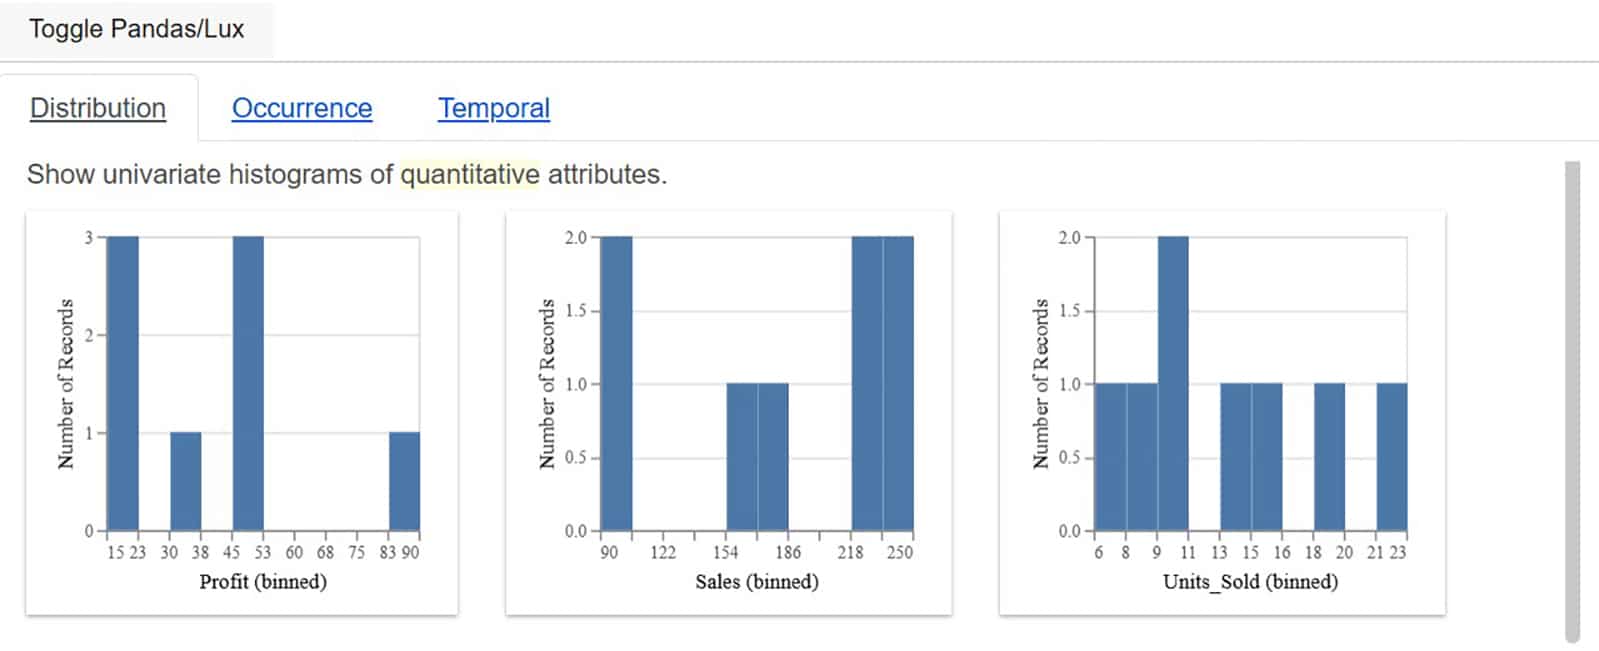
The Lux library in Python has excellent features for data analytics, data engineering and visualisation. Coding is minimal, and no complex code and scripts need to be written. It also offers integration with the Pandas library in Python. Lux reduces the manual efforts required for plotting and data visualisation with the support of large datasets. This helps to develop and deploy large-scale real-time applications.
Lux integrates various features in Python including automatic visualisation suggestions, intelligent data profiling, minimal code usage, Pandas DataFrame integration, toggle visualisation mode, interactive visual widgets, chart recommendation engine, quick summary stats, outlier identification support, Jupyter notebook compatibility, built-in analytics insights, correlation detection tools, user intent specification, export visualisation options, attribute-based exploration, faceted visual comparisons, visual filtering interface, multi-chart generation, and many others. All these features enable highly effective visualisation in data engineering and analytics-based projects.
Lux integrates the following functions for plotting and advanced visualisation:
- Intent specification for statistical data analytics
- Metadata analysis
- Faceted chart generation
- Correlation analysis and views
- Relationship views
- Recommendation sections with statistics
- Querying and filtering
You can use the following code to install Lux in Google Colab:
!pip install lux-api
from google.colab import output
output.enable_custom_widget_manager()
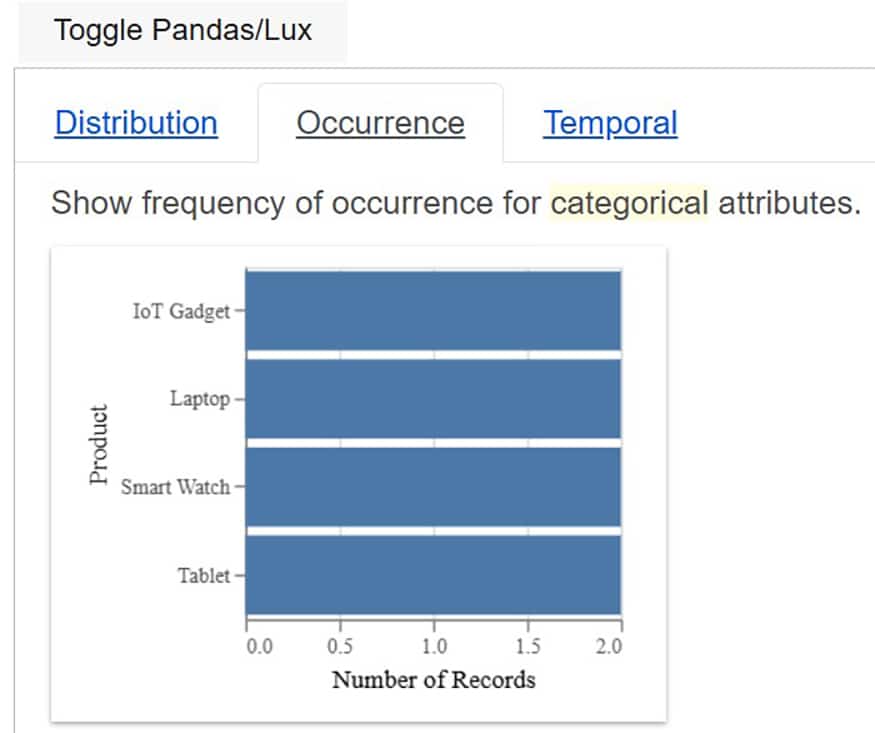
LUX Python Code for Visualization of Sample Dataset in Script
import lux
import pandas as pd
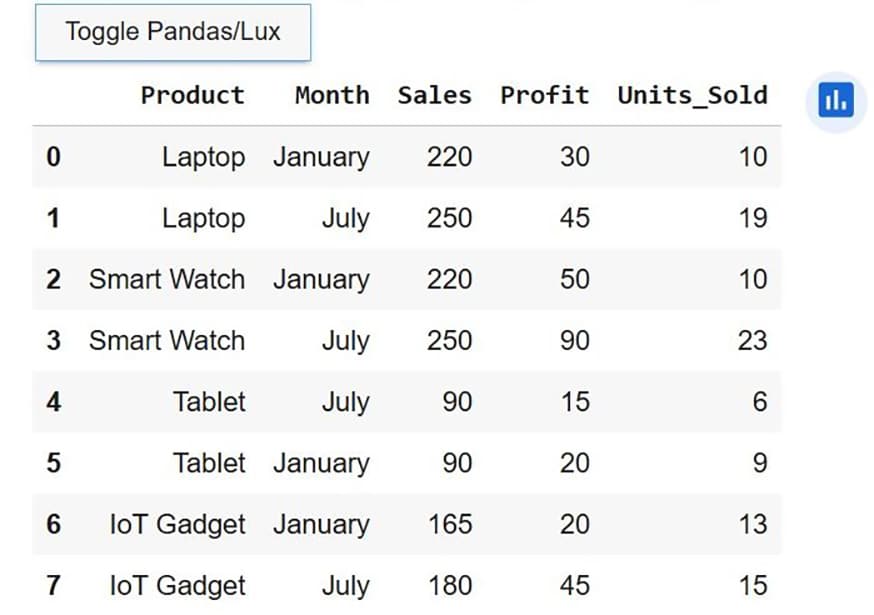
# Sample Dataset for Visualization
data = {
«Product»: [«Laptop», «Laptop», «Smart Watch», «Smart Watch», «Tablet», «Tablet», «IoT Gadget», «IoT Gadget»],
«Month»: [«January», « July «, « January «, «July», « July «, «January», « January «, «July»],
«Sales»: [220, 250, 220, 250, 90, 90, 165, 180],
«Profit»: [30, 45, 50, 90, 15, 20, 20, 45],
«Units_Sold”: [10, 19, 10, 23, 6, 9, 13, 15]
}
df = pd.DataFrame(data)
# Visualization with Display using Lux
df
For data visualisation and plotting, software developers need to use special libraries like Seaborn, Matplotlib, Plotly, Folium, etc. By using Lux in Python, there is no need to integrate dedicated plotting and visualisation libraries. Lux itself provides all the features needed for dynamic visualisation and auto identification of the attributes required for data analytics.


