There are many software packages that help create graphs and charts using PHP. One such package is JpGraph. It is released under a dual licence the QPL 1.0 (Qt Free License) for open source or educational use, and the JpGraph Professional License for commercial use. Lets discuss the open source version of JpGraph in this article.
Installation
The package can be downloaded from http://jpgraph.net/download/. Currently, there are two different packages for PHP4 and PHP5. Select the appropriate link. You may extract the files anywhere, preferably in the document root (e.g., /var/www).
In order to use JpGraph, you will also have to download the gd library for PHP:
sudo apt-get install php5-gd
To check whether the library has been installed properly, type the following command:
php5 -m
You should see gd in the list. See Figure 1.
Thats it! Now we can start creating graphs.


Creating a line graph
Let us look at how to create a simple line graph. Locate the directory where jpgraph.php can be found. Include this file in your code:
require_once(jpgraph/src/jpgraph.php);
Next, in order to draw a line graph, you need to include the jpgraph_line.php file, as follows:
require_once(jpgraph/src/jpgraph_line.php);
Now, to create a graph, instantiate the Graph class by passing its width and the height, respectively.
$graph = new Graph(300, 400); //300 is the width and 400 is the height $graph->SetScale(intln); //set the scale of the graph
Prepare the data to be plotted as a line graph using an array:
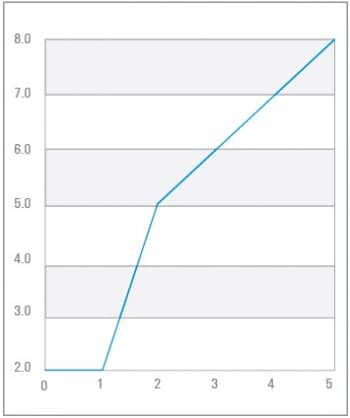
$data = array(2, 2, 5, 6, 7, 8);
Now create the plot:
$plot = new LinePlot($data);
Add the plot to the graph using the Add function:
$graph->Add($pplot);
Finally, display the graph using the Stroke function:
$graph->Stroke();
The graph for the above code is shown in Figure 2.

Creating a bar graph
In order to create a bar graph, include the code from jpgraph.php as well as from jpgraph_bar.php. jpgraph_line.php is not required here.
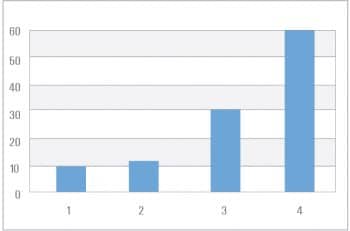
require_once(jpgraph/src/jpgraph.php); require_once(jpgraph/src/jpgraph_bar.php); //create the graph $graph = new Graph(350,220); //set the width and the height $graph->SetScale(textlin); //set the scale of the graph $data=array(10,12,30,60); //prepare the data // Create the bar plots and add it to the graph $barplot = new BarPlot($data); $graph->Add($barplot); $graph->Stroke(); //display the graph
The graph for the above code is shown in Figure 3.
You may use the package to create various other types of graphs as well. Go ahead and explore JpGraph!


