Today, an enterprise has data from a variety of sources, with internal data coming from local infrastructure, home grown applications, databases, enterprise resource planning (ERP) systems and customer relationship management (CRM) systems. Enterprises collect data from external sources such as social media and blogs to analyse end users’ comments on their products and services, and how these fare with respect to competition. The data is multi-structured. Firms face the huge challenge associated with the volume, velocity and variety of data.
Making sense of this data deluge requires careful harnessing and analytical tools to gain the right insights. An open source platform can typically provide the much needed diversity to combine data exploration, data model extraction and discovery of relationships. This can be used to come with up a context based approach for sentiment analysis.
In this article, we propose an open source stack that can serve as a building block to handle multi-structured data that assists data scientists to get actionable insights and suggest recommendations. The actionable insights could be on purchasing behaviour, product sentiments, services offered by the enterprise and their quality. We will also provide details of a use case from the retail industry and how this can be extended to other verticals.
The platform for multi-structured data handling
Let us briefly cover the components of the open source stack that we will be using for handling multi-structured data.
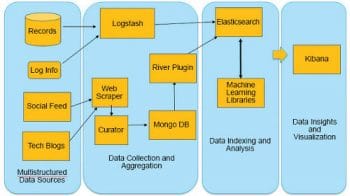
ELK: This is an open source software stack that combines Elasticsearch, Logstash and Kibana, and is primarily geared to handle multi-structured data to deliver real-time insights. Elasticsearch is an indexer. It has the built-in capability to perform basic and advanced search besides analysis of the data. Logstash collects various types of data, and has the ability to parse and format the data. Further, it sends this information to applications such as Elasticsearch for indexing the transformed data. Kibana is a Web based application that helps in visualisation and analysis of the data. It helps in creating dashboards. MongoDB is a document database that can handle unstructured data. NLTK and Scikit are software libraries performing natural language parsing, tokenisation, automatic keyword extraction and machine learning. Figure 1 illustrates a data science stack with open source components.
Data stages
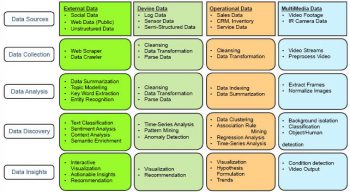
We consider both structured and unstructured data resources. The in-house data has structured sources of information. They are from databases comprising inventory, sales information pertaining to the stocks on hand, item numbers, average costs, availability, location, etc. The data from blogs is unstructured and provides us insights into purchasing behaviour, sentiments about the products, their quality and services offered by the enterprise. A typical data flow using multi-structured data with open source components is shown in Figure 2. It illustrates the various input resources for collecting data in an enterprise to get insights for intelligent product allocation, to improve the customer experience, to develop and execute marketing campaigns and to initiate product enhancements.
The analysis, discovery and insights for the various data sources are given in the diagram (see Figure 2). These stages are realised using the open source stack shown in Figure 1. The enterprise, like a retail store, can get insights by amalgamating data from external sources such as the Internet for unstructured data – blogs, tech sources, social media – and from internal sources comprising log data from machines, databases, devices and applications, as well as structured data from databases.
Data Science Methodology
The data science methodology is described in the following paragraphs.
Data extraction: The unstructured data from blogs and tech blogs are extracted using scrapers in Python. The hyperlinks for these blogs are either pre-determined or those which can be intelligently obtained through a crawler, which is a script to browse the Web automatically. Scrapy is a tool in Python used for scraping data for instance, lets consider a scenario in the retail industry, where we can fetch information on leather bags based on different brands and models. These can be further segmented based on a number of features. A feature set could include comments based on the colour and shape of the bag, design, and type of the bag (such as whether it’s for women, men or children). The bag could be of use in offices, homes or parties. Scrapy is a tool in Python used for scraping data.
Data curatorship and archival: The extracted data can be curated to remove special characters, disclaimers, and filter redundant messages present in the original data. Intermediate data could be stored in temporary files. The curated data from temporary storage is archived in MongoDB through the Python interface. The data from Mongo DB is pushed into Elasticsearch through a Mongo River plugin whenever there are new data changes.
Data model: The unstructured messages in the MongoDB fields are analyzed for sentiments using machine learning libraries in NLTK, R.
A supervised training model is created from the curated data using the available machine learning algorithms such as Naïve Bayes and Support Vector Machine (SVM). The accuracy for the classifier model is computed, and can be improved by subjecting the model to repeated learning by going through multiple iterations. The product sentiments for new data are predicted using the training model and these are updated in MongoDB.
Data indexing: The River plugin ensures that data changes in MongoDB are immediately available in Elasticsearch, which indexes the data and searches can be performed based on queries built into the system.
Data enrichment: Knowledge bases such as WordNet can help to enrich the information by deriving key characteristics from the metadata. The ontologies of WordNet can help in determining the meaning of the words in the data and mapping them to the metadata feature set.
Data visualisation and insights: Kibana is used to build dashboards for displaying the information in the unstructured data received from the Web, as well as the information received from top contributors to the feature set and the enriched information. It displays information received from top contributors to the feature set and the enriched information from WordNet. Dashboards are also built for inventory and sales information received from internal databases. These dashboards will provide the insights into the existing in-house data, while the external data points to the preferences of the end users and technical experts.
A case study in the retail industry
Intelligent product allocation is a use case for the retail industry, which considers a combination of in-store retail inventory, sales data and social Web analytics to improve decision-making.
The solution for the use case is to have a list of key indicators and a business metric for creating a positive impact. The key measurements are:
Extracting top selling brands and models along with key features of the product from social media
Inventory information from internal data
Based on the above measurements, a business metric needs to be arrived for an intelligent and improved product allocation.
An important activity is to determine and finalise the features for extraction. These identified key features are extracted from various blogs and social media. One example is given below.
Unstructured Data: Few comments on Bags from Social Media and Technical blogs for the key features are given below:
- “Is this item and color in stock and available? I want to purchase two of them.”
- “I liked this shoulder bag but I want to know if it is pure leather.”
- “I would like to know which bag is on sale. Some pictures display a plain black leather bag, but other pictures show a bag with a few prints on the sides.”
- “This bag has a lot of room to get all of my stuff into it. I don’t use the shoulder strap because the handles are great and the zippered compartments are big enough.”
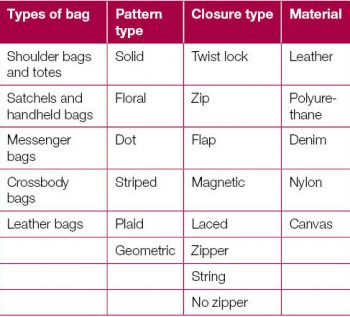
Structured Data: From inventory is given in table 2 and table 3
These two tables are examples of the inventory data for the bags available in the store.
Analysis of the multi-structured data
Combining the product preferences, popular characteristics of the bags referred by people in social media and in-store inventory data, the system can come up with a score card to help the retailer perform an intelligent product allocation and inventory optimization.
The retailer can also come up with a dashboard on customer experience, by taking into account users spending time at a promotion zone, in the aisle and time taken to make a purchase.
For analysis of unstructured data, text mining algorithms can be used for automatic extraction of keywords. These include key features of the product, along with the models and brands retrieved from social media and blogs.

Results and discussion
Popular keywords in unstructured data: The word cloud in Figure 3 depicts the popular features and characteristics of bags extracted from social media and blogs..
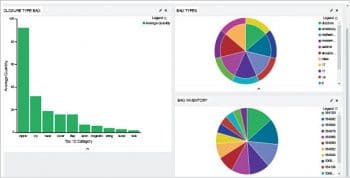
Figure 4 shows the Kibana dashboard of the various types of bags, the popular characteristics from social media and in-store inventory levels.
A few analyses based on the comments received on social media and on blogs related to the bags are given below:
- People are more concerned about the product than the store they buy them in.
- Adjustable and detachable features like shoulder straps appear to be important for buyers.
- While colour, material/fabric and style are important, people are also conscious of pricing.
- Crown and crocodile print based designs are most commented on and popular.
Data insights
From the comments on the blogs, we get to know that print designs are one of the key elements that customers are looking at. However, bags of this design are not available in-store. Hence, it would be appropriate to stock these popular bag designs as soon as possible. These inputs can help retailers in the decision-making process related to product assortment and promotional offers. Similarly, new insights can be obtained by combining different data sources.
Amalgamating multi-structured data in an enterprise using open source technologies and methods can help an enterprise to gain insights into data and perform intelligent product allocation. It can also help sales personnel to send out effective messages to the customer. This can also help in improving product literature, highlighting the key features that customers are looking for.
The example from the retail industry are applicable to other industry verticals such as telecom, utilities and manufacturing Specific use cases in telecom can be in customer churn risk prediction, improving the experience in customer care channels, real-time promotions, etc. Input data sources will be from social media, call logs, CRM and billing information. A solution that addresses these use cases can positively impact awareness of customer tastes and reduce the customer churn rate.


