The trick in managing networks is to anticipate glitches and problems, and nip them in the bud before they can do much harm. To manage and monitor networks manually is tedious and time consuming, besides being quite impossible when there are a large number of nodes; hence the need for monitoring tools. This article gives you a sampling of the most indispensable monitoring tools.
Consider today’s computer networks, which are large complex systems, in which many components of various vendors are integrated in order to pass on information. These networks range from small campuses to large geographical regions and worldwide networks. The main purpose of having these networks is to share information among computers. Networks have various applications like email, online transaction processing, remote connectivity, downloading and various social media activities. Organisations that have installed these network applications require that these applications run without any hiccups. For this, network managers have to monitor the network in order to facilitate information flow and to check the status of all network equipment.
Network monitoring is regarded as difficult and demanding, yet a vital part of any network or systems administrator’s job. Network monitoring enables operators to fully understand the current behaviour of the network. So, accurate and efficient monitoring is important to ensure that the network operates according to the defined manner and network administrators find it easier to troubleshoot any sort of error in the network. Network monitoring is defined as the process of capturing network traffic and inspecting it closely to determine what is happening on the network.
Organisations require their network to be up and functioning 24×7 in order to generate revenue, for which they need the right set of tools to monitor and manage the network. Some tools are open source while some are proprietary and hence quite expensive. Organisations have heterogeneous environments comprising multiple network hardware and software from different vendors running under the same roof, for which the network monitoring solution needs to be flexible enough to adapt to changing environments and should support various kinds of hardware and software.
In order to provide organisations dynamic and flexible solutions for network monitoring, the preferred methodology, nowadays, is to make use of open source network monitoring tools. But finding the most suitable tool for network monitoring that fits the precise needs of a particular organisation is quite a challenging task as there are numerous options available.
The various open source tools currently available cover almost all requirements for monitoring networks. These include Nagios, Zabbix, Cacti, openNMS, Icinga, Op5, Munin, Network Management Information System (NMIS), NetXMS, etc.
Let us delve deeper into these tools to get an idea of their features and technicalities.
Nagios
Nagios, now known as Nagios Core, is a free, open source and powerful network monitoring tool which facilitates monitoring systems, networks and infrastructure, and ensures that all sorts of critical systems, applications and services are always up and running efficiently. Nagios Core offers monitoring and alerting services for servers, switches, applications and all sorts of network services. If any problem arises in the network, Nagios Core alerts the administrators about it and alerts them again when the issue gets resolved.
Nagios Core is regarded as the heart of the application, which comprises the core network monitoring engine and the basic Web based UI. On the top of Nagios Core, administrators can implement plugins to facilitate administrators with additional monitoring capabilities like services, applications, data visualisations, graphs and even MySQL database support.
There are various versions of Nagios:
a. Nagios XI facilitates easy monitoring of mission-critical infrastructure like applications, services, operating systems, network protocols, system metrics and network infrastructure.
b. Nagios Log Server simplifies the process of log data searching, as it automates the process of alerts when any potential threat is identified and quickly logs the data. The Nagios log server enables administrators to search for all sorts of network logs at one location with high availability and fault tolerance features.
c. Nagios Network Analyser provides in-depth lookup of all network traffic sources and security threats, enabling systems admins to gather all the information to monitor the health of the network.
d. Nagios Fusion provides network administrators with an easy and in-depth comprehensive view of multiple Nagios Core or Nagios XI servers.
Version 4.1.1 is the latest release of Nagios available for free download under GPLV2.
Listed below are the main features of Nagios Core.
- Monitors all sorts of network services like SMTP, HTTP, HTTPS, NNTP, SNMP, SSH, FTP, etc.
- Monitors all host resources like processor load, disk usage and all operating systems like Windows, Linux and their event logs.
- Remote network monitoring via Nagios Remote Plugin Executor.
- Proper data visualisation via graphs using plugins.
- Can define event handlers to run during service or host events for proactive problem resolution.
Nagios agents: These are listed below.
- NRPE: Nagios Remote Plugin Executor (NRPE) allows remote system monitoring of various resources like disk usage, system load and number of users logged in.
- NRDP: Nagios Remote Data Processor (NRDP) has a flexible data transport mechanism and processor, and uses standard ports and protocols (HTTP and XML).
- NSClient++: This is used to monitor various services of Windows machines like memory usage, CPU load, disk usage, running processes, etc.
- NCPA: Nagios Cross Platform Agent (NCPA) supports installation on Windows, MAC OS X and Linux for monitoring CPU usage, disk usage, processes, services and network usage.
Zabbix
Zabbix is regarded as an enterprise oriented open source monitoring tool for networks and all sorts of application software. It works with a centralised Linux based Zabbix server.
Zabbix is designed to do all sorts of monitoring and tracking with regard to network services, servers and various network hardware. It makes use of MySQL, PostgreSQL, SQLite, Oracle or IBM DB2 to store the data. It offers data gathering and monitoring options for servers and even supports the monitoring of virtual machines.
Architecture: Zabbix architecture is composed of three different servers/components—the Web server, the database server and the Zabbix server. In addition, using the whole Zabbix architecture in large environments allows us to have two other actors, i.e., Zabbix agents and Zabbix proxies, which also play a crucial role in efficient overall network monitoring.
Zabbix server acquires data from Zabbix proxies, which in turn acquire data from the Zabbix agents connected to them. And with all the data stored on a database server, the whole system will be monitored via a Web based UI.
The latest version of Zabbix is 3.0.3 which was released in May 2016.
The unique features of the Zabbix network monitoring system are listed below:
- Zabbix has a centralised Web interface for monitoring all servers, services and other network hardware.
- Zabbix systems are easy to integrate with other systems because of the API available in varied programming languages.
- Zabbix enables systems administrators to monitor the network via SNMP, IPMI, JMX, ODBC, SSH, HTTP, HTTPS, TCP/UDP, etc.
- Other features include: Web monitoring, secure user authentication, flexible email notifications, audit log and agent-less monitoring.
- The Zabbix monitoring system offers a wide range of customisation options for items, graphs and data visualisation.
Cacti
Cacti is regarded as a complete open source Web based graphical network monitoring tool written in PHP/MySQL. It makes use of the RRDTool (Round Robin Database Tool) to store data, generate graphics and collect network traffic data using the Net-SNMP protocol. Being a powerful network monitoring tool, Cacti allows systems administrators to collect data from almost any sort of network hardware like routers, switches, firewalls, load balancing equipment as well as servers, and presents the data in properly visualised graphs.
The front-end of Cacti can handle multiple users, each with their respective graph sets, and is mostly used by Web hosting providers to monitor the bandwidth statistics of customers. The back-end of Cacti has two forms: cmd.php —a PHP based executable script for smaller installations, or Spine — a C-based poller that can scale to thousands of hosts.
The operation of the Cacti Web based monitoring tool is divided into three different tasks, which are described below.
Data retrieval: Cacti makes use of a poller to retrieve data. Its application is executed at regular intervals of time under varied OSs to monitor routers, switches, servers and other network hardware. Cacti makes use of the SNMP protocol for live monitoring of data from various devices.
Data storage: Cacti makes use of the RRDTool to store data either in a SQL or flat database. RRD is a system to store, and shows time series data collected from different SNMP-capable devices.
Data presentation: Cacti has an inbuilt graph presentation based utility to deploy graphs as per the reports based on the time series data collected from various network devices. Graphs, in turn, provide fast and easy visualisation of data for network administrators to maintain the health of the network 24×7.
The latest version of Cacti is 0.8.8h, and was released in May 2016. Its features are listed below:
- Unlimited graph items, graph data manipulation and graph templates
- Built-in SNMP support, user based management and security
- Data source templates and host templates
- Data gathering on a non-standard time span
- Fully flexible and dynamic data sources
OpenNMS
OpenNMS is regarded as an enterprise grade free and open source network monitoring and management platform for systems and network administrators. It was developed to create a pure, distributed, scalable management application platform for all aspects of network management with special focus on fault and network performance management.
Open NMS provides automated and directed discovery and provisioning, event and notification management, service assurance and performance measurement.
OpenNMS is built using the Java programming language and is available for free under GNU version 3. The OpenNMS package provides us with a complete network management solution which can scale up to thousands of nodes to easily and effectively collect and store network information. OpenNMS enables network administrators to monitor all sorts of resources, quotas, network usage statistics, etc. Data can be further analysed via graphs, and OpenNMS provides a proper Web user interface for all sorts of data related to network devices. This highly dynamic and flexible tool enables systems administrators to customise dashboards, duty schedules and on-call calendars on a per-user or per-group basis.
The current version of OpenNMS is 18.0, which was released in May 2016.
Its features are:
- Event management and notification: OpenNMS is based on the principle of ‘Publish and subscribe’. Processes in the software can publish events and other processes can subscribe to them.
- Discovery and provisioning: OpenNMS consists of an advanced provisioning system for adding devices to the management system by submitting the range of IP addresses to the system. It consists of adopters to integrate with other processes within the application as well as external software like a dynamic DNS server and RANCID.
- Server monitoring: OpenNMS monitors network based services ranging from very simple ICMP pings to complex protocols like SMTP or page sequence monitoring.
- Data collection: OpenNMS collects information of various protocols like SNMP, HTTP, JMX, XMP, XML, NSClient and JDBC.
Icinga
Icinga is a free, open source, scalable and extensible network monitoring application which checks the availability of resources, notifies users of outages and provides extensive business intelligence data. Its new features include a Web 2.0 style user interface, additional database connectors for MySQL, Oracle and PostgreSQL, and a REST API that lets administrators integrate various extensions without modifying the Icinga Core.
The latest release of Icinga is version 2.4.9, which came out in May 2016.
Architecture: Icinga Core is developed in C language and has a modular architecture with a standalone core, user interface and database on which users can install various plugins and add-ons.
The components of the architecture are:
1. Icinga Core: This manages all sorts of monitoring tasks and receives various results from plugins. The core communicates the results to IDODB through the IDOMOD interface and the IDO2DB service daemon over SSL encrypted TCP sockets.
2. Icinga 2: This manages monitoring tasks, running checks and the sending of all sorts of alert notifications. It can be enabled on-demand, such as the ‘checker’ or ‘notification’ component.
3. User interfaces: Icinga has two types of user interfaces.
(a) Icinga Classical UI: This is based on Nagios CGIs and has new features added to this interface such as pagination, JSON output and CSV export.
(b) Icinga Web: This is also known as the new Web and has a Web 2.0 inspired front-end to offer drag and drop customised dashboards. It communicates to the core, database and other third party add-ons.
4. Icinga Data Out Database: This acts as a storage point for historical data monitoring for add-ons.
5. Icinga Reporting: This is a reporting module based on the open source Jasper Reports. The reporting module provides template based reports with varied access levels, and automated report generation and distribution.
6. Icinga Mobile: This is a user interface for smartphones and tablets. It is available for iOS, Android, BlackBerry, etc, and is based on JavaScript and Sencha Touch.
Important plugins of Icinga are:
1. Performance monitoring: PNP4Nagios, NagiosGrapher and InGraph
2. Configuration interfaces and tools: Nconf, Nagios QL and LConf
3. Business process monitoring: Business process add-ons
4. Network visualisation: NagVis and Nagmap
5. Windows monitoring: NSClient++ and Cygwin
6. SNMP trap monitoring: SNMPTT and NagTrap
Op5 Monitor
Op5 is free and open source server and network monitoring software based on Nagios. Op5 specialises in displaying the status, health and performance of IT networks and has an integrated log server and Op5 logger. Op5 is developed and supported by Op5 AB.
The various products under Op5 are listed below.
1. Op5 Free: This is a perfect product for small IT offices. Basically, it is very easy to use and understand, and can monitor all types of servers and network devices, along with applications.
2. Op5 Pro: This is more suitable for organisations in need of single system development. It provides comprehensive monitoring for servers, network devices, applications, databases, storage and even cloud based services.
3. Op5 Ent+: This is suitable for large enterprises for monitoring devices and all sorts of servers.
4. Op5 Live: This is easy to use software available and suitable for everyone.
The following are the features of the Op5 monitoring software.
1. Server monitoring: Monitors all sorts of servers and provides alerts, reports and graph based visualisation. Op5 is efficient in monitoring physical, virtual, cloud and even hybrid server environments.
2. Virtual monitoring: Fully efficient network monitoring software for monitoring VMware ESX, vSphere, KVM, Citrix Zen and even Microsoft Hyper V.
3. Cloud monitoring: Op5 provides facilities to systems administrators to completely monitor SaaS, PaaS and IaaS, along with other types of cloud infrastructure.
4. Open source: As it is completely open source and based on Nagios, there are no problems as such, in implementation.
5. Scalable: Op5 is highly flexible and scalable for monitoring large volumes of disk drives and handles distributed monitoring as well as load sharing in an easy manner.
6. Data centre monitoring: It is very efficient in managing and monitoring data centres comprising physical and virtual servers, application management and unified computing.
7. Reporting: It manages loads of information from various IT hardware and software, and presents the reports in a comprehensive manner in easy GUI based graphs for thorough understanding by systems administrators.
8. Integrated log server monitoring: The Op5 logger provides centralised storage to log various events, which enhances security and data integrity.
Important extensions of Op5 Monitor are:
- Op5 Monitor Peer
- Op5 Monitor Poller
- Op5 Monitor Cloud Extension
Munin
According to its official website, “Munin is a networked resource monitoring tool that can help analyse resource trends and “what just happened to kill our performance?” problems. It is designed to be very plug and play. A default installation provides a lot of graphs with almost no work.”
Munin is a free and open source network and system monitoring tool, which provides systems administrators with the great advantage of monitoring and alerting services for servers, switches, applications, etc. It is written in PERL programming language and uses the RRDTool to create graphs. It can be accessed via a simple Web interface. Munin provides comprehensive performance monitoring of computers, networks, SANs, applications, etc.
The latest version of Munin is 2.99.3 and its features are listed below:
- Munin runs a munin-node service on every monitored box, and the Munin server connects to the munin-node via TCP port 4949 to retrieve the data.
- Provides comprehensive data visualisation using graphs, giving the status as OK, WARN, CRITICAL or UNKNOWN.
- More than 500 monitoring plug-ins are available till date.
Network Management Information System
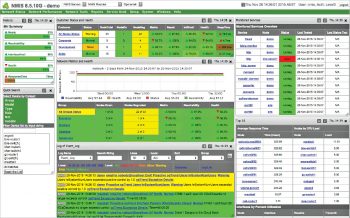
Network Management Information System (NMIS) is regarded as an open source network management system licensed under GNU license v3. It can play a crucial role in monitoring the performance of an organisation by measuring IT environments, assets and fault monitoring as well as other valuable information.
NMIS provides a highly scalable, flexible and easy to implement and maintain network monitoring environment for IT organisations. It can run both in physical and virtual environments, and can manage thousands of devices that have a vast amount of storage at a single point of time.
The latest version available is NMIS 8.5.10G, which was launched in September 2015.
Its features are:
- Performance management and real-time monitoring
- Operation tools and distributed monitoring
- Faults and events monitoring, and real-time notification
- Business rules engine
- Scalability and management reporting
- UI designed to provide specialised views, to avoid missing the wood for the trees in large environments
- Extremely efficient monitoring system
NetXMS
NetXMS is an open source enterprise graded multi-platform management and monitoring system, which provides comprehensive monitoring of event management, performance, alerting, reporting and graphing for all layers of IT infrastructure—from network devices to the business application layer.
Architecture: NetXMS architecture is three tiered.
1. Information is collected by monitoring agents — either high-performance agents or SNMP agents.
2. Information is delivered to the monitoring server for processing and storing.
3. Information is displayed via a rich client application or Web interface.
The latest version is 2.0.4, which was released in June 2016.
Its features are:
- Unified platform for management and monitoring of entire IT infrastructure.
- Designed for maximum performance and scalability.Distributed network monitoring and automated network discovery.
- Business impact analysis tools; quick deployment with minimal efforts.
- Easy and simple integration with a wide range of products.
- Flexible and easy to use.


