There’s nothing more annoying than a slow network connection. If you are a victim of poorly performing network devices, this article may help you to at least alleviate, if not solve, your problem.
The improvement in the performance of networking devices like switches, routers and connectors such as Ethernet cables has been huge in recent years. But our microprocessors lag behind when it comes to processing the data received and transferring it through them.
Your organisation can spend money to buy high quality Ethernet cables or other networking devices to send terabytes or petabytes of data but may not experience performance improvements because, ultimately, the data has to be dealt with by the operating-system kernel. That is why, to get the most out of your fast Ethernet cable, as well as high bandwidth support and a high data transmission rate, it is important to tune your operating system. This article covers network performance monitoring and tuning methods—mostly parameters and settings available in the OS and network interface card (NIC)—that can be tweaked to improve the performance of your overall network.

How your operating system deals with data
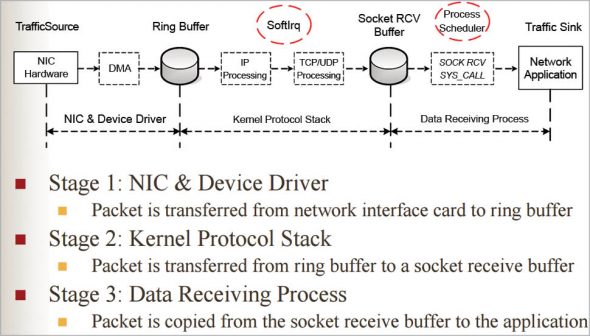
Data destined to a particular system is first received by the NIC and is stored in the ring buffer of the reception (RX) present in the NIC, which also has TX (for data transmission). Once the packet is accessible to the kernel, the device driver raises softirq (software interrupt), which makes the DMA (data memory access) of the system send that packet to the Linux kernel. The packet data in the Linux kernel gets stored in the sk_buff data structure to hold the packet up to MTU (maximum transfer unit). When all the packets are filled in the kernel buffer, they get sent to the upper processing layer – IP, TCP or UDP. The data then gets copied to the preferred data receiving process.
Note: Initially, a hard interrupt is raised by the device driver to send data to the kernel, but since this is an expensive task, it is replaced by a software interrupt. This is handled by the NAPI (new API), which makes the processing of incoming packets more efficient by putting the device driver in polling mode.
Tools to monitor and diagnose your system’s network
ip: This tool shows/manipulates routing, devices, policy routing and tunnels (as mentioned in the man pages). It is used to set up and control the network.
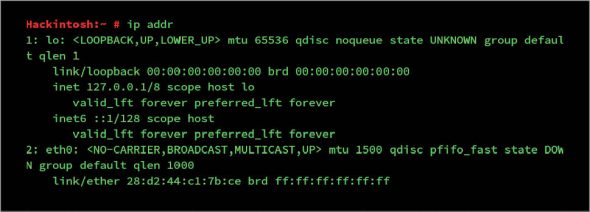
ip link or ip addr: This gives detailed information of all the interfaces. Other options and usage can be seen in man ip.
netstat: This utility shows all the network connections happening in your system. It has lots of statistics to show, and can be useful to find bottlenecks or problems.
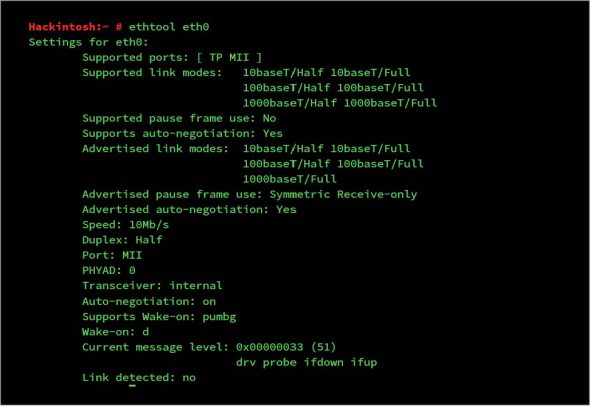
ethtool: To tune your network, ethtool can be your best friend. It is used to display and change the settings of your network interface card.
ethtool eth0: This shows the hardware setting of the interface eth0.
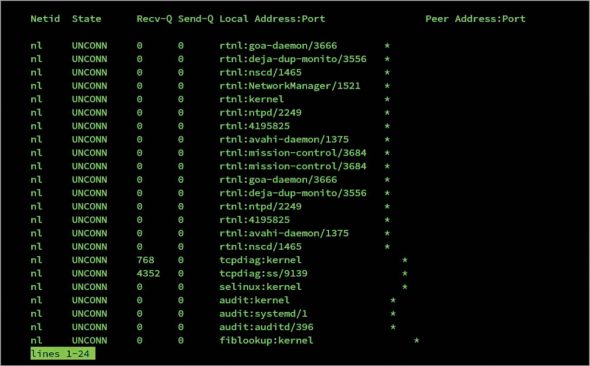
ss: This is another helpful tool to see network statistics and works the same as netstat.
ss –l: This shows all the network ports currently opened.

Benchmark before tuning
To get maximum or even improved network performance, our goal is to increase the throughput (data transfer rate) and latency of our network’s receiving and sending capabilities. But tuning without measurement (effected values) is useless as well as dangerous. So, it is always advisable to benchmark every change you make, because any change that doesn’t result in an improvement is pointless and may degrade performance. There are a few benchmarking tools available for networks, of which the following two can be the best choices.
Netperf: This is a perfect tool to measure the different aspects of a network’s performance. Its primary focus is on data transfer using either TCP or UDP. It requires a server and a client to run tests. The server should be run by a daemon called netserver, through which the client (testing system) gets connected.
By running both server and client on localhost, I got the output shown in Figure 6.
Remember that the netperf default runs on Port 12865 and shows results for an IPv4 connection. Netperf supports a lot of different types of tests but for simplicity, you can use default scripts located at /usr/share/doc/netperf/examples. It is recommended that you read the netperf manual for clarity on how to use it.
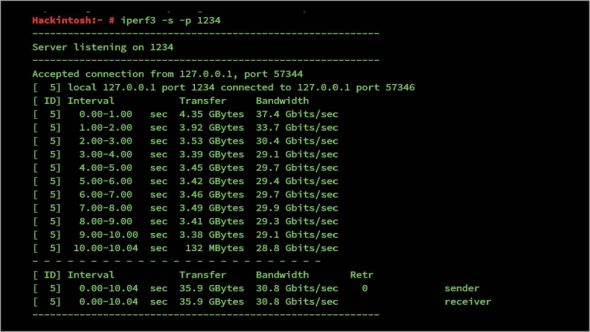
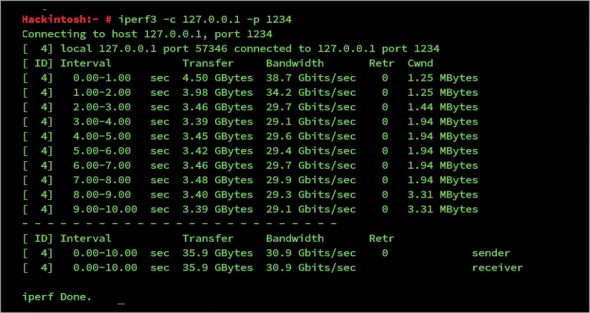
Iperf: This tool performs network throughput tests and has to be your main tool for testing. It also needs a server and client, just like netperf.
To run iperf as the server, use $iperf -s -p port, where ‘port’ can be any random port.
On the client side, to connect to the server, use $iperf -c server_ip -p server_port. The result (Figure 8) has been tested on my localhost as both server and client, so the output is not appropriate.
Start the tuning now
Before proceeding to tune your system, you must know that every system differs, whether it is in terms of the CPU, memory, architecture or other hardware configuration. So a tunable parameter may or may not enhance the performance of your system as there are no generic tweaks for all systems. Another important point to remember is that you must develop a good understanding of the entire system. The only part of a system that should ever be tuned is the bottleneck. Improving the performance of any other component other than the bottleneck will result in no visible performance gains to the end user. But the focus of this article is on the general, potential bottlenecks you might come across; even on healthy systems, these tweaks may give improved performance.
One obvious situation to tune your network for is when you start to drop received packets or transmit/ receive the message ‘error has occurred’. This can happen when your packet holding structures in the NIC, device driver, kernel or network layer are not able to handle all the received packets or are not able to process these fast enough. The bottleneck in this case can be related to any of the following:
- NIC
- Soft interrupt issued by a device driver
- Kernel buffer
- The network layer (IP, TCP or UDP)
It’s better to find the exact bottleneck from among these options and then tune only that area. Or you can apply the methods given below, one by one, and then find which changes improve performance.
To find out the packet drop/error details, you can use the ip utility.
More specific results can be viewed by using ethtool, as follows:
ethtool -S eth0
Tuning the network adapter (NIC)
Jumbo frames: A single frame can carry a maximum of 1500 bytes by default as shown by the ip addr command.
Here, for eth0, which is the default network interface for the Ethernet, the MTU (maximum transfer unit) value is set to 1500. This value is defined for a single slot. Ethernet connections of 10Gbps or more may need to increase the value to 9000. These large frames are called Jumbo frames. To get Ethernet to use Jumbo frames, you can use ifconfig, as follows:
$ifconfig eth0 mtu 9000
Note: Setting the value to 9000 bytes doesn’t make all frame sizes that large, but this value will be only used depending on your Ethernet requirements.
Interrupt Coalescence (IC)
After the network adapter receives the packets, the device driver issues a single hard interrupt followed by soft interrupts (handled by NAPI). Interrupt Coalescence is the number of packets the network adapter receives before issuing a hard interrupt. Changing the value to cause interrupts fast can lead to lots of overhead and, hence, decrease performance, but having a high value may lead to packet loss. By default, your settings are in adaptive IC mode, which auto balances the value according to network traffic. But since the new kernels use NAPI, which makes fast interrupts much less costly (performance wise), you can disable this feature.
To check whether the adaptive mode is on or not, run the following command:
$ ethtool -c eth0
To disable it, use the following command:
$ethtool -C eth0 adaptive-rx off

Caution: If your system generates high traffic as in the case of a hosting Web server, you must not disable it.
Pause frames
A pause frame is the duration of the pause, in milliseconds, which the adapter issues to the network switch to stop sending packets if the ring buffer gets full. If the pause frame is enabled, then loss of packets will be minimal.
To view the pause frame setting, use the following command:
$ethtool -a eth0
To enable pause frames for both RX (receiving) and TX (transferring), run the command given below:
$ethtool -A eth0 rx on tx on
There are lots of other things you can tune using ethtool to increase performance through the network adapter, like speed and duplex. But these are beyond the scope of this article. You can check them on the ethtool manual.
Software interrupts
SoftIRQ timeout: If the software interrupt doesn’t process packets for a long time, it may cause the NIC buffer to overflow and, hence, can cause packet loss. netdev_budget shows the default value of the time period for which softirq should run.
$sysctl net.core.netdev_budget
The default value should be 300 and may have to be increased to 600 if you have a high network load or a 10Gbps (and above) system.
# sysctl -w net.core.netdev_budget=600
IRQ balance: Interrupt requests are handled by different CPUs in your system in a round robin manner. Due to regular context switching for interrupts, the request handling timeout may increase. The irqbalance utility is used to balance these interrupts across the CPU and has to be turned off for better performance.
$service irqbalance stop
If your system doesn’t deal with high data receiving and transmission (as in the case of a home user), this configuration will be helpful to increase performance. But for industrial use, it has to be tweaked for better performance, as stopping it may cause high load on a single CPU – particularly for services that cause fast interrupts like ssh. You can also disable irqbalance for particular CPUs. I recommend that you do that by editing /etc/sysconfig/irqbalance. To see how to balance specific CPUs, visit http://honglus.blogspot.in/2011/03/tune-interrupt-and-process-cpu-affinity.html.
Kernel buffer
The socket buffer size is:
net.core.wmem_default
net.core.rmem_default
net.core.rmem_max
net.core.wmem_max
These parameters show the default and maximum write (receiving) and read (sending) buffer size allocated to any type of connection. The default value set is always a little low since the allocated space is taken from the RAM. Increasing this may improve the performance for systems running servers like NFS. Increasing them to 256k/4MB will work best, or else you have to benchmark these values to find the ideal value for your system’s configuration.
$sysctl  -w net.core.wmem_default=262144.
$sysctl -w net.core.wmem_max=4194304
$sysctl -w net.core.rmem_default=262144
$sysctl -w net.core.rmem_max=4194304
Every system has different values and increasing the default value may improve its performance but you have to benchmark for every value change.
Maximum queue size
Before processing the data by the TCP/UDP layer, your system puts the data in the kernel queue. The net.core.netdev_max_backlog value specifies the maximum number of packets to put in the queue before delivery to the upper layer. The default value is not enough for a high network load, so simply increasing this value cures the performance drain due to the kernel. To see the default value, use sysctl with $sysctl net.core.netdev_max_backlog. The default value is 1000 and increasing it to 3000 will be enough to stop packets from being dropped in a 10Gbps (or more) network.
TCP/UDP processing
The TCP buffer size is:
net.ipv4.tcp_rmem
net.ipv4.tcp_wmem
These values are an array of three integers specifying the minimum, average and maximum size of the TCP read and send buffers, respectively.
Note: Values are in pages. To see the page size, use the command $getconf PAGE_SIZE
For the latest kernel (after 2.6), there is a feature for auto tuning, which dynamically adjusts the TCP buffer size till the maximum value is attained. This feature is turned on by default and I recommend that it be left turned on. You can check it by running the following command:
$cat /proc/sys/net/ipv4/tcp_moderate_rcvbuf
Then, to turn it on in case it is off, use the command given below:
$sysctl -w net.ipv4.tcp_moderate_rcvbuf=1
This setting allocates space up to the maximum value, in case you need to increase the maximum buffer size if you find the kernel buffer is your bottleneck. The average value need not be changed, but the maximum value will have to be set to higher than the BDP (bandwidth delay product) for maximum throughput.
BDP = Bandwidth (B/sec) * RTT (seconds), where RTT (round trip time) can be calculated by pinging to any other system and finding the average time in seconds. You can change the value with sysctl by using the following command:
$sysctl -w net.ipv4.tcp_rmem=”65535 131072 4194304”
$sysctl -w net.ipv4.tcp_wmem=”65535 131072 194304”
Maximum pending connections
An application can specify the maximum number of pending requests to put in queue before processing one connection. When this value reaches the maximum, further connections start to drop out. For applications like a Web server, which issue lots of connections, this value has to be high for these to work properly. To see the maximum connection backlog, run the following command:
$ sysctl net.core.somaxconn
The default value is 128 and can increase to much secure value.
$sysctl -w net.core.somaxconn=2048
TCP timestamp
TCP timestamp is a TCP feature that puts a timestamp header in every packet to calculate the precise round trip time. This feature causes a little overhead and can be disabled, if it is not necessary to increase CPU performance to process packets.
$sysctl -w net.ipv4.tcp_timestamps=0
TCP SACK
TCP Selective Acknowledgements (SACK) is a feature that allows TCP to send ACK for every segment stream of packets, as compared to the traditional TCP that sends ACK for contiguous segments only. This feature can cause a little CPU overhead; hence, disabling it may increase network throughput.
# sysctl -w net.ipv4.tcp_sack=0
TCP FIN timeout
In a TCP connection, both sides have to close the connection independently. Linux TCP sends a FIN packet to close the connection and waits for FINACK till the defined time mentioned in…
net.ipv4.tcp_fin_timeout.
The default value (60) is quite high, and can be decreased to 20 or 30 to let the TCP close the connection and free resources for another connection.
$sysctl -w net.ipv4.tcp_fin_timeout=20
UDP buffer size
UDP generally doesn’t need tweaks to improve performance, but you can increase the UDP buffer size if UDP packet losses are happening.
$ sysctl net.core.rmem_max
Miscellaneous tweaks
IP ports: net.ipv4.ip_local_port_range shows all the ports available for a new connection. If no port is free, the connection gets cancelled. Increasing this value helps to prevent this problem.
To check the port range, use the command given below:
$sysctl net.ipv4.ip_local_port_range
You can increase the value by using the following command:
$sysctl -w net.ipv4.ip_local_port_range=’20000 60000’
Tuned
Tuned is a very useful tool to auto-configure your system according to different profiles. Besides doing manual tuning, tuned makes all the required tweaks for you dynamically. You can download it by using the following command:
$apt-get install tuned
To start the daemon, use the command given below:
$tuned -d
To check the available profiles, you can see man tuned-profiles. You can create your own profile but for the best network performance, tuned already has some interesting profile options like network-throughput and network-latency. To set a tuned profile, use the following command:
$tuned -p network-throughput


Making changes permanent
The changes made by sysctl get lost on every reboot; so to make them permanent, you need to save these changes to /etc/sysctl.conf.
For example:
$echo ‘net.ipv4.tcp_moderate_rcbuf=1’ >>/etc/sysctl.conf
There are many more tuning parameters available in Linux, which you may want to change for better network performance. But it is recommended that you understand these features well before trying them out. Blind tuning can only be good if you benchmark continuously and properly to check if the changes are leading to positive results.
Interesting places to find other available parameters are net.core and net.ipv4.




Interesting performance tweaks covered. it really helped my issue narrow down at last . so i am applying these steps one by one ..