If you are looking for an enterprise-class open source network, application and server monitoring tool, there is no better option than Nagios. This article explores the very popular Nagios network infrastructure monitoring tool.
It is not uncommon for the IT department in an organisation to run into problems and spend a great deal of time on troubleshooting. So there is always a need to be more proactive and prevent these issues. It is also worthwhile to optimise the performance of the infrastructure and the network. When a problem occurs, figuring it out immediately and troubleshooting it is strenuous. Most of the problems tend to build up over a period of time. Monitoring the devices and the network is crucial in preventing major issues and enhancing performance. Moreover, if the health of the IT environment is not monitored, how can one ensure efficient service to the end users? Having total visibility of your infrastructure is paramount in preventing issues and making informed decisions to shape the future of the IT environment.
Monitoring not only helps in preventing IT disasters, it also has a lot of other advantages. It enables data-driven insights and helps in decision making. We can improve productivity and performance using this data. It prevents downtime and business losses. It can also help to cut down a company’s budget and increase savings. Keeping track of the performance of hardware and software resources involves having first-hand knowledge of the health of the network and a complete control over IT resource usage trends.
Introducing Nagios
There are numerous open source and commercial products in the market for monitoring the network and the infrastructure. Some of the well known open source monitoring tools are Nagios, Zabbix, Cacti, Icinga, Groundwork, OpenNMS and Hyperic. Among these, Nagios is the most powerful tool. It is a framework that is capable of monitoring a large network of around 100,000 hosts and almost all components. Nagios can be integrated with third party tools. It uses the concept of modularity via plugins, which provide support for protocols, operating systems, system metrics, applications, services, Web servers, websites, middleware, etc.
Nagios does not have any internal monitoring logic. It is unaware of what is to be monitored and contains no built-in proprietary interpreters. It only does what it is instructed to do in a way one expects it to be done. Nagios lets the user intelligently schedule monitoring programs in any language. These monitoring programs are called plugins, which report the monitoring status back to Nagios. It has lots of hooks that make it easy to get data in and out; so it can provide real-time data to graphing programs such as RRDTool and MRTG, and can easily work along with other monitoring systems, either by feeding them or by being fed by them.
Nagios Core and Nagios XI
Nagios Core is open source whereas Nagios XI is a commercial, enterprise version of Nagios. Unlike Nagios Core, Nagios XI is completely Web-based. It is also wizard driven. The dashboards are more robust and personalised. There are plenty of additional features in the enterprise version such as an advanced UI, maintenance tools, integration with third-party ticketing and much more.
How does Nagios work?
Nagios was developed for Linux but is now capable of monitoring UNIX based operating systems. It has three components — the daemon, the Web interface, and the plugins. Nagios has four basic object types, which are listed below.
Commands: These are used to interact with the plugins, and to control the event handlers, notifications and checks.
Contact and contact groups: These define the individuals to be contacted in case of an event.
Host and host groups: These are used to specify services and hosts in a particular network.
Notifications: These define what content needs to be sent to contacts and contact groups when there are drifts.
Services: These specify network services such as HTTP/80, SSH, FTP, etc, and host services such as clock, DNS entries, etc.
Host and service check definitions instruct Nagios which plugins to call to obtain the status of a host or service. The definitions in the plugins are checked against that particular host/service. If it is seen going beyond the threshold, Nagios notifies the contacts/contact groups. Nagios returns any one of the following four status codes for any event:
- 0-OK
- 1-Warning
- 2-Critical
- 3-Unknown
Nagios can be configured to do either passive checks or active checks. In active checks, the host that runs Nagios ‘polls’ devices or services for status information every so often, whereas passive checks are initiated and performed by external applications/processes. The results are then sent to the monitoring host (where Nagios runs) for processing. The major difference between active and passive checks is that active checks are initiated and performed by Nagios, while passive checks are performed by external applications. Passive checks can be used to monitor asynchronous services and to monitor the services that are located behind a firewall. Active checks can be used for on-demand checks and regular interval checks. The results can be monitored via the Web GUI, which is CGI based.
Features
The features of Nagios are listed below:
- Centralised view of the entire monitored IT infrastructure
- Automatic restart of failed applications is granted by its event handlers
- Multi-user access
- Selective access allows clients to view only the infrastructure components that affect them
- Monitoring of network services like SMTP, POP3, HTTP, NNTP, PING, etc
- Monitoring of host resources such as processor load, disk usage, etc
- Parallelised service checks
- Ability to define network host hierarchy using ‘parent’ hosts, allowing detection of and distinction between hosts that are down and those that are unreachable
- Optional Web interface for viewing current network status, notifications and problem history, log files, etc
- Powerful script APIs allow easy monitoring of in-house and custom applications, services, and systems
- Availability reports ensure SLAs are being met
- Failover capabilities ensure non-stop monitoring of critical IT infrastructure components
Installation
Let’s install Nagios on Ubuntu 16.x (or above) where SELinux is not in an enforcing state.
Prerequisite: Graphics library to display the monitoring on the Web front-end (Apache). Use the following commands to download it:
$sudo apt-get update

$sudo apt-get install -y autoconf gcc libc6 make wget unzip apache2 php libapache2-mod-php7.0 libgd2-xpm-dev
Download Nagios from the source, as follows:
$cd /tmp

$wget -O nagioscore.tar.gz https://github.com/NagiosEnterprises/nagioscore/archive/nagios-4.3.4.tar.gz

$ttar xzf nagioscore.tar.gz
Compile the source using the following code:
$cd /tmp/nagioscore-nagios-4.3.4/

$sudo ./configure --with-httpd-conf=/etc/apache2/sites-enabled

$sudo make all
Create User nagios and www-data. Add www-data to the Nagios group, as follows:
$sudo useradd nagios

$sudo usermod -a -G nagios www-data
Install binaries, HTMLs and CGIs by giving the following command:
$sudo make install
Install and configure the service or daemon that has to start on booting up, as follows:
$sudo make install-init

$sudo update-rc.d nagios defaults
Next, install the *SAMPLE* configuration files to allow Nagios to start:
$sudo make install-config
Install the Apache Web server configuration files and configure Apache settings, as shown below:
$sudo make install-webconf

$sudo a2enmod rewrite

$sudo a2enmod cgi
Configure the firewall to allow Port 80 inbound traffic on the local firewall in order to reach the Nagios Core Web interface, as follows:
$sudo ufw allow Apache

$sudo ufw reload
Create an Apache user account to be able to log into Nagios. This username and password would be used to log in to the Nagios Web page:
$sudo htpasswd -c /usr/local/nagios/etc/htpasswd.users nagiosadmin
Restart Nagios Core and Apache Service, as follows:
$sudo systemctl restart apache2.service

$sudo systemctl start nagios.service
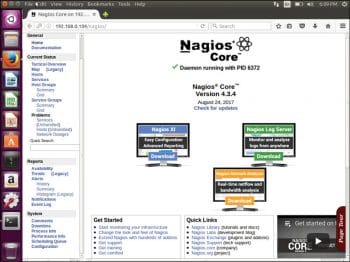
To test how Nagios Core works, open the Nagios Web client in the browser at http://<ip address or FQDN>/nagios. The page that appears is shown in Figure 1.
The host and services page will display errors as there are no plugins installed, but once they are, these errors will get resolved. Here are steps to install plugins from the Nagios Plugin Package.
Download the prerequisites as follows:
$sudo apt-get install -y autoconf gcc libc6 libmcrypt-dev make libssl-dev wget bc gawk dc build-essential snmp libnet-snmp-perl gettext
Next, download and compile the source, and install the plugins:
$cd /tmp

$wget --no-check-certificate -O nagios-plugins.tar.gz https://github.com/nagios-plugins/nagios-plugins/archive/release-2.2.1.tar.gz

$tar zxf nagios-plugins.tar.gz

$cd /tmp/nagios-plugins-release-2.2.1/

$sudo ./tools/setup

$sudo ./configure

$sudo make

$sudo make install
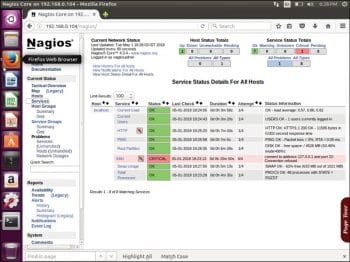
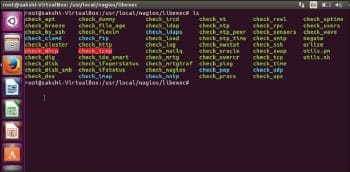
Restart Nagios Service and reload the Nagios Web page. Now the errors in the host and services page will be resolved as shown in Figure 2. The plugins will now be located in /usr/local/nagios/libexec/ (see Figure 3).
Writing a custom plugin
Nagios plugins can be written in any language. Based on the exit code, Nagios decides the status of the service. Here is an example of a custom plugin to check the status of the Apache service running locally. The program written to check the status of this service should be placed in /usr/local/nagios/libexec. As this program can be written in any language, the code for it is not shown here. Let us consider it to be a shell script, check_apache.sh. To run this check as a command, it should be defined in /usr/local/nagios/etc/objects/commands.cfg as:
# ‘check_apache’ command definition

define command{

command_name check_apache

command_line $USER1$/check_apache.sh

}
$USER1$ variable is a local Nagios variable pointing to /usr/local/nagios/libexec. One can associate this command to a service, and then to a host by defining it in /usr/local/nagios/etc/objects/localhost.cfg.
# Define a service to check apache on local machine.

define service{

use local-service

host_name localhost

service_description apache

check_command check_apache

}
Now check whether the configuration is free from all errors and restart the Nagios service by running the following commands:
$sudo /usr/local/nagios/bin/nagios -v /usr/local/nagios/etc/nagios.cfg

$sudo systemctl reload-or-restart nagios.service
After the execution, the status will be reflected in the Web UI.
The benefits of Nagios
Nagios is one of the best open source monitoring tools available in the market. It is modular and has a straightforward approach, which makes it easy to use. One can add functionalities to meet specific needs. Nagios can work with other tools like Check_mk and Vigilo NMS to provide the user with additional functionalities. This makes Nagios very flexible. It can be easily scaled to a large number of hosts and to a large network. Nagios uses compilers and binaries as well as scripts, the utility of which is facilitated by an ingenious abstraction layer.


