Grafana is an open source analytics and monitoring tool for all databases. It is widely used in industry to monitor a wide range of objects including infrastructure and applications.
It can be used for the visualisation and plotting of data in various graphical formats.
The prolific use of smart gadgets and Internet connected devices has created a need to evaluate the resulting data sets. We require these data sets collected from multiple channels for effective and high performance knowledge discovery and predictive analytics. This domain is directly associated with data science, in which assorted techniques are used for data analytics, along with statistics, computational engineering, machine learning and many others.
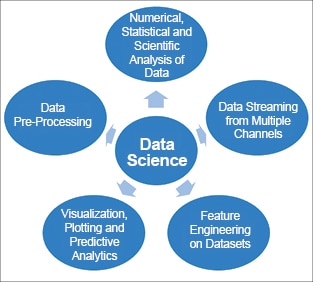
The stream of data science integrates a number of key constituents so that the data sets can be analysed with accuracy.
The key elements and perspectives of data science include data streaming, data pre-processing, feature engineering, analysis and plotting.
Grafana: A high performance tool for data science
Plotting and visualisation are important and frequently used approaches in data analytics. Data scientists and researchers need to visualise the results so that the accuracy and required outcomes can be analysed from the data sets.
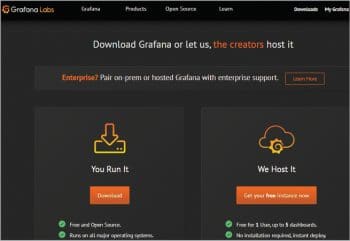
Grafana (https://grafana.com) is a free and open source tool that is used for the tasks associated with multi-dimensional plotting and visualisation.
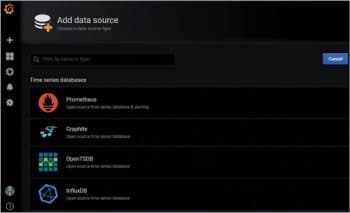
Installation and how Grafana works
Grafana is integrated with a set of tools and plugins that facilitate connectivity with multiple databases and channels. It is compatible with assorted data sources and channels including Graphite, MySQL, Loki, Prometheus, AWS, ElasticSearch, Postgres, InfluxDB, Google StackDriver, OpenTSDB, and many others.
High performance features and modules for data science are available in Grafana. These include the following:
- The generation of multi-dimensional graphs and plots
- The capability to explore data metrics
- Dynamic dashboards
- Ad hoc queries and filtering
- Logs analysis
- Alerts management for visual options
- Annotations with graphs
- Advance search and visualisation
- Processing of mixed and assorted data sources
- Data distribution
- An inbuilt graphite query parser
- Support for rich templates
- Dynamic collaboration
- Data dissemination, and sharing of dashboards and data
Grafana is being widely used for corporate applications in data analytics and the exploration of metrics using ad hoc queries on the data sources. There are many enterprise level implementations in various domains.
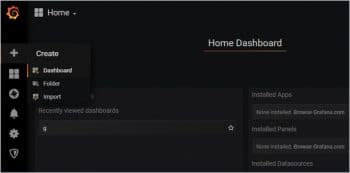
After downloading the Grafana library, the directory structure has a bin folder in which the grafana-server file is executed. On running the grafana server script, the Web browser based engine is activated and can be executed on any Web browser including Google Chrome, Mozilla Firefox, and Opera.
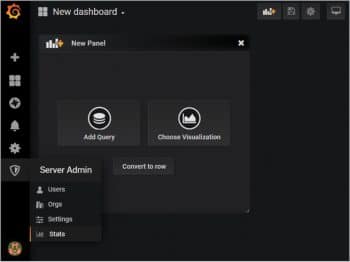
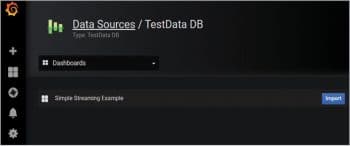
The Grafana Web browser based application uses the URL http://localhost:3000 so that data science implementations can be done with the inbuilt visualisation and plotting, with cavernous analytics.
Grafana provides cloud compatibility so data scientists and researchers can directly use Grafana Cloud without manual installation. The cloud flavour of Grafana integrates the dashboard for data analytics and visualisation, in which different data sets can be analysed. The cloud version of Grafana is available free.
Grafana provides excellent power and features to import data sources from a wide range of database engines including Structured Query Language (SQL), Not Only SQL (NoSQL), JavaScript Object Notation (JSON), and many others.
The server administration panel in Grafana enables the evaluation of data with multiple and multi-dimensional statistics. The user management and logs analysis can be done in this panel, for security and integrity (Figure 4).
A number of additional data sources and plugins are distributed on https://grafana.com/grafana/plugins. These plugins can be integrated with the existing installation of Grafana for data analytics (Figure 5).
Research tasks in Grafana can be easily implemented using built-in templates, which can be used for data science projects associated with different applications (Figure 6).
Using the Grafana tool, the plotting and visualisation tasks can be done with multiple types of graphs and charts, ensuring that data analytics is highly accurate (Figure 7).
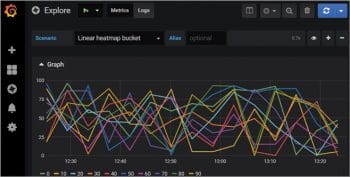
Besides the traditional bar graphs, line graphs and bubble plots, a number of multi-dimensional visualisation based plots are available in Grafana (Figure 8).
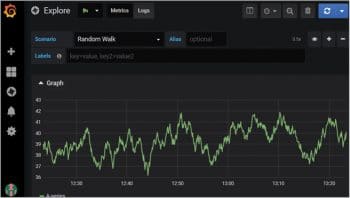
Scope for research and development
For research projects associated with data science and predictive knowledge discovery, there are numerous software tools and frameworks available that have their own key features. Grafana is a high performance tool that is used by data scientists and researchers for multi-dimensional plotting and visualisation, which are very important to complete any real-time data science project. Researchers and practitioners can use Grafana Desktop or Grafana Cloud for the tasks associated with visualisation of scientific data and the results obtained from the data science algorithms, so that accurate outcomes can be presented.


