


Applications are tested rigorously for their functionality by developers, who spend a lot of time in doing so. Static Application Security Testing (SAST) is an important step or perhaps the very first step in the DevSecOps pipeline. It is the analysis and testing of the static code of complex projects. SAST is not to be confused with normal code testing as it includes security, too, in its acronym. The focus of this article is SAST and how it can be implemented using open source tools like Snyk and SonarQube.
SAST gives a detailed analysis of the code and a list of all the bugs that might not be obvious but are making an application vulnerable. It is followed by other testing phases where the security of the project is continuously checked.
Why Snyk and SonarQube?
SAST can be done by plenty of tools, so why Snyk and SonarQube? Snyk helps in detecting bad dependencies and monitors them continuously. Active suggestions, automatically sending pull requests for dependency checks, real-time alerts on vulnerabilities, and managing the dependency tree is easy with Snyk. On the other hand, SonarQube takes input as files and checks them on different parameters like unit tests, duplicated code segments, bugs, coding standards, comments, complexity, etc. It then stores the calculated metric in a database and displays it in a dashboard. SonarQube is scalable and can support many languages. Let us dive deep into both these tools.
SAST with Snyk
According to Snyk.io, Snyk is used by various tech giants like Google, Intuit, Salesforce, MongoDB, etc. You will love using Snyk since it provides the bug list and tells the ways to fix them. It has a strong and rich database of vulnerabilities that it uses. It supports various languages too. So, write in any language, and Snyk will be there to help you with SAST. Snyk is available as an open source tool and has commercial editions too. We have used the open source version of Snyk in this article. Let’s move on to installations and ways to use Snyk.
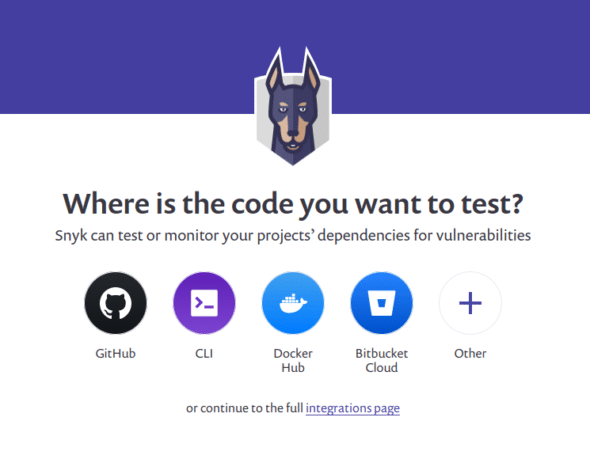
We are using Jenkins and Docker in some places. We can get the security of our static applications tested using Snyk, either by using it as a web application that runs in a browser or by installing it and running it with Jenkins as a plugin. The first way is easy. All you have to do is go to Snyk.io and create an account or login if you already have one. It will ask the location of your code, as shown in Figure 1. As the code is on GitHub, select it. The project we are testing here is ‘Classroom Management System for IIIT-B’, and is written in Java using the Spring Boot Framework. The project allows professors to request for a classroom of their choice according to time, strength of students, projectors and plugs required, etc. These requests are accepted or rejected by the administrator. This open source project is available on GitHub at https://github.com/shriyakabra97/ClassroomManagementSystem.
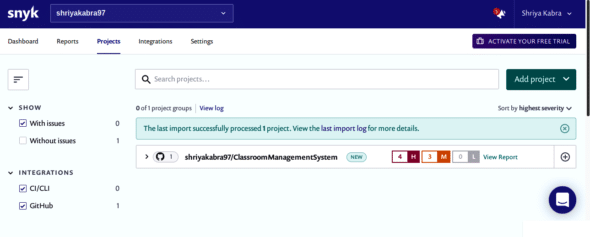
After selecting the source code location (GitHub in our case), it will ask you to enter your GitHub credentials and select the project repository that you want to test. After successfully performing this, you will be steered to the Snyk dashboard, as shown in Figure 2, and will be able to see your project’s report here. As we can see, the project was successfully processed and four high, three medium, and zero low vulnerabilities were reported.
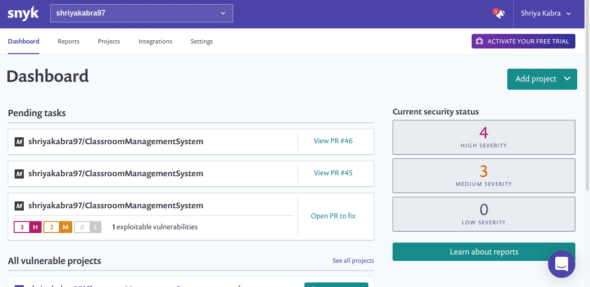
The full report of SAST is shown in Figure 3. The count and description of vulnerabilities and bugs are shown according to their severity, along with the vulnerable pull requests (PR).
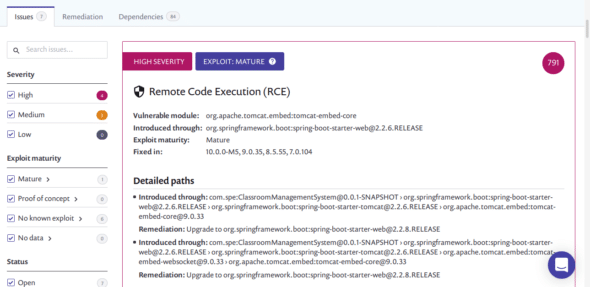
Figure 4 shows an issue of remote code execution. This is one of the many vulnerabilities in the project. The report describes its severity and nature of the exploit. It shows the module that introduced this issue and the detailed paths. In the end, it suggests some ways of fixing the issue.
Now, let us move to the second way — consolidating with Jenkins and testing as a Jenkins job. For using Snyk from the command line interface (CLI), we require curl, node.js, and npm installed. Run the subsequent commands to install Snyk:
$ sudo apt-get install curl
$ curl -sL https://deb.nodesource.com/setup_12.x | sudo -E bash -
$ sudo apt-get install nodejs
$ sudo npm install -g snyk
$ snyk auth
A link in the browser will pop open and will ask you to authenticate. After authenticating, run the following command for installing snyk-to-html, which will be used for report generation in HTML format:
$ sudo npm install snyk-to-html –g
Go to Jenkins (localhost: 8080) and navigate to ‘Manage Plugins’. Go to the Available tab and search for ‘Snyk Security’ and ‘HTML Publisher’ plugins. Install these plugins, and then create a freestyle Jenkins project with the configuration given below:
Source Code Management: git repository URL of your project
Build: Select Execute Shell and write in text box
cd ${WORKSPACE}
echo “snyk test && snyk monitor” > snyk.sh
chmod +x snyk.sh
/bin/bash snyk.sh || true
snyk test --json | snyk-to-html -o results.html
Post-build actions: Select Publish HTML reports and change the name of the report to result.html.
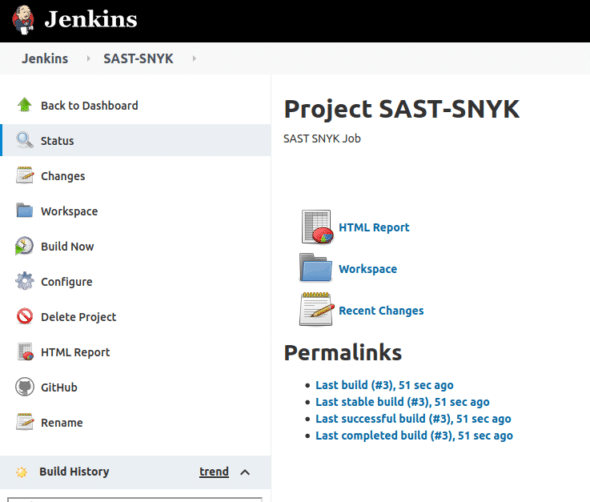
Save and build the project. An HTML report can be found, as depicted in Figure 5.
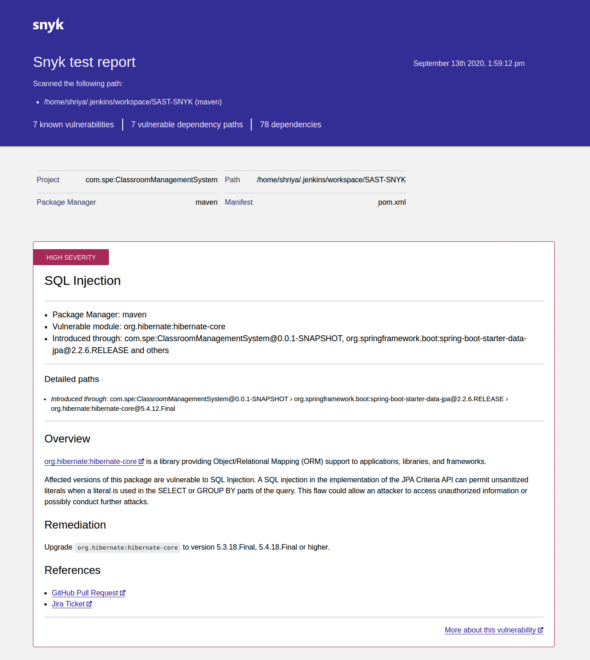
Download the HTML report from this location. The report includes all the important information like the vulnerabilities, their severity, bad dependencies, origin, remediation, and references, as shown in Figure 6.
SAST with SonarQube
Another tool we are discussing is SonarQube. It is a self-activating code review tool for ascertaining vulnerabilities, bugs and code smells in the project code. For its installation, we will use a Docker image of SonarQube.
Installing SonarQube server
1. The community edition Docker image of SonarQube is obtainable at https://hub.docker.com/_/sonarqube/.
2. Establish the server by executing the command given below:
$ sudo docker run -d --name sonarqube -p 9000:9000 <image_name>
3. Open SonarQube accessible at http://localhost:9000 using your browser, and log in with systems administrator identifiers. The default user name and password is ‘admin’. After a successful login, the SonarQube Projects page will open, from where you can create a new project or open an existing one.
Analysing a Java/Maven project
Follow these steps to analyse a Java/Maven project:
1. Select the ‘Create new project’ button.
2. Select ‘Manually’ for generating the project.
3. A new page loads, where we must assign a ‘Project Key’ and a ‘Display Name’ for the project and confirm it by pressing the ‘Set Up’ button. These need to be unique.
4. Now, we are redirected to another page where we must generate a token. Under ‘Provide a Token’, select ‘Generate a Token’ to generate it, or enter the name of an existing token if you wish to reuse the token. This token is used to generate the command for running the analysis on CLI.
5. Select the major language and go along with the specified instructions to examine your project. As we are using Maven or Gradle for our project, the scanner has been downloaded by default. SonarQube generates a command, as shown below:
mvn sonar:sonar \
-Dsonar.projectKey=cms-java-sast \
-Dsonar.host.url=http://localhost:9000 \
-Dsonar.login=c88f4b568cc5f669d48b9fff0facca130dd3a6a5
This command is different for different tokens and project names. Run the command generated by SonarQube for testing your project.
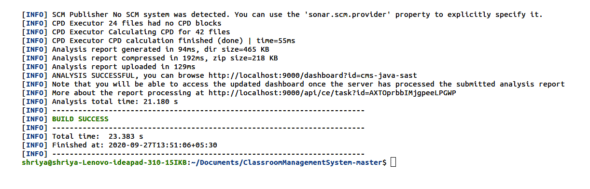
6. Now, go to the project folder and run the above command there. On successful analysis, Build Success will look as shown in Figure 7.
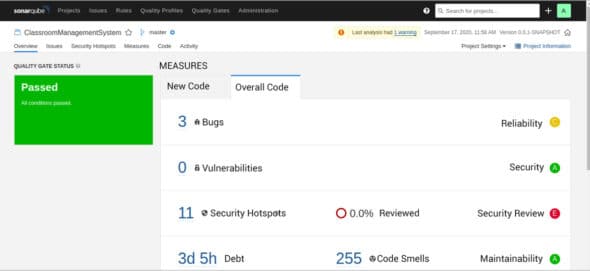
After successfully passing inspection of your code, you will see your foremost analysis on SonarQube (localhost: 9000), as manifested in Figure 8. It is evident from Figure 8 that the analysis was successful and there are three bugs, zero vulnerabilities, and eleven security hotspots. Code smells and technical debt time are also shown in the report.
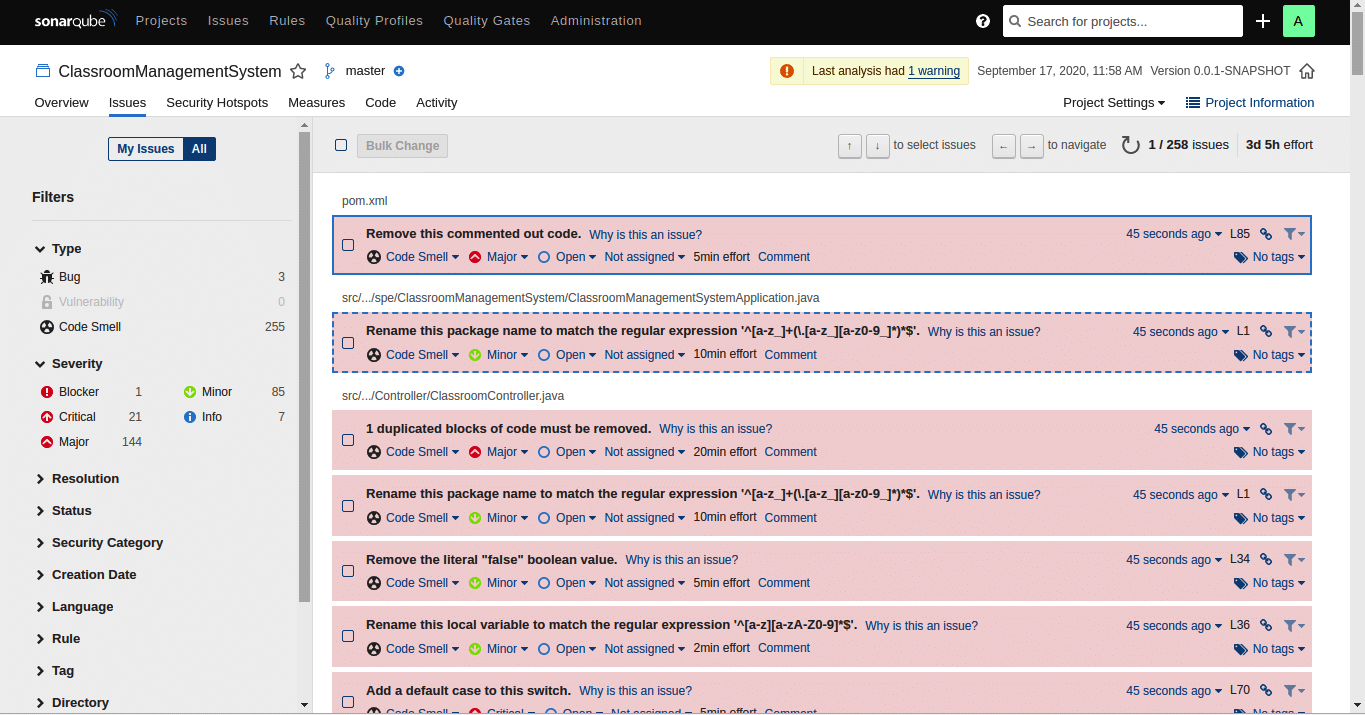
On switching to the ‘Issues’ tab in the dashboard, the screen shown by Figure 9 comes up. All the issues of different severity are listed. Navigation to other properties like resolution, status, etc, is also possible from the left panel.
Analysing a Python project
The Python project that we will be using is available on GitHub at http://github.com/RahulSapparapu/iiitbfeedback. For the Python project, we must download the sonar-scanner at https://docs.sonarqube.org/latest/analysis/scan/sonarscanner/. For Python projects, no distinct scanner is available. Therefore, we must install ‘SonarScanner’, which solves this issue as it is used when there is no distinct scanner at hand for your build system.
1. Go to your project’s root directory and create a file named sonar-project.properties. This will serve as a configuration file for the project; the contents of the file are given below:
# must be unique in a given SonarQube instance
sonar.projectKey=my:project
# --- optional properties ---
# defaults to project key
#sonar.projectName=My project
# defaults to ‘not provided’
#sonar.projectVersion=1.0
# Path is relative to the sonar-project.properties file. Defaults to .
#sonar.sources=.
# Encoding of the source code. Default is default system encoding
#sonar.sourceEncoding=UTF-8
2. Unzip the downloaded sonar-scanner file into any location on your system:
$install_location for upcoming steps.
3. Now, we must re-equip the global settings to locate the SonarQube server by modifying (if not already modified):
$install_location/conf/sonar-scanner.properties
Next are the contents of this file:
#Configure here general information about the environment, such as SonarQube server connection details for example
#No information about specific project should appear here

#----- Default SonarQube server
#sonar.host.url=http://localhost:9000

#----- Default source code encoding
#sonar.sourceEncoding=UTF-8
4. Now, we must update the path environment variable by adding the $install_location/bin directory to it.
5. You can confirm your installation by executing the following command on a new shell:
$ sonar-scanner –h
6. Now run the command created by SonarQube from your project’s root location to initiate the inspection:
$sonar-scanner \
-Dsonar.projectKey=feedback -Dsonar.sources=. \
-Dsonar.host.url=http://localhost:9000 \
-Dsonar.login=3fe1d8ed5a4931eff32602004bcd8c6dd7f15f13
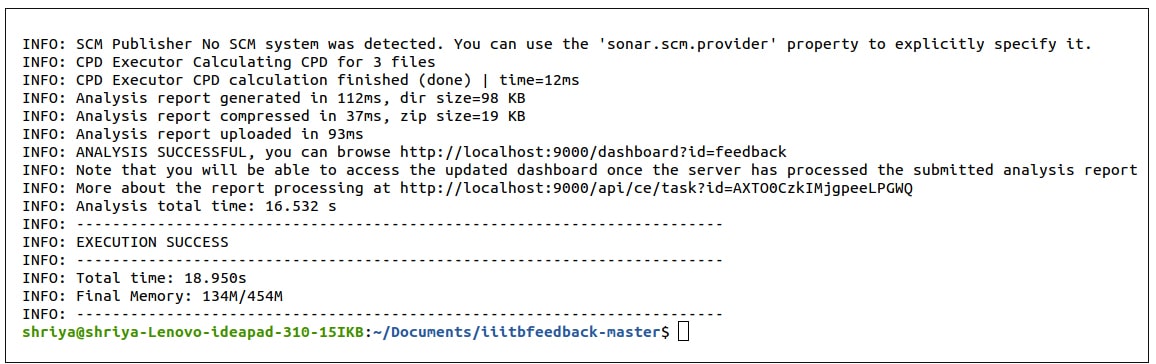
The output of successful execution is shown in Figure 10.
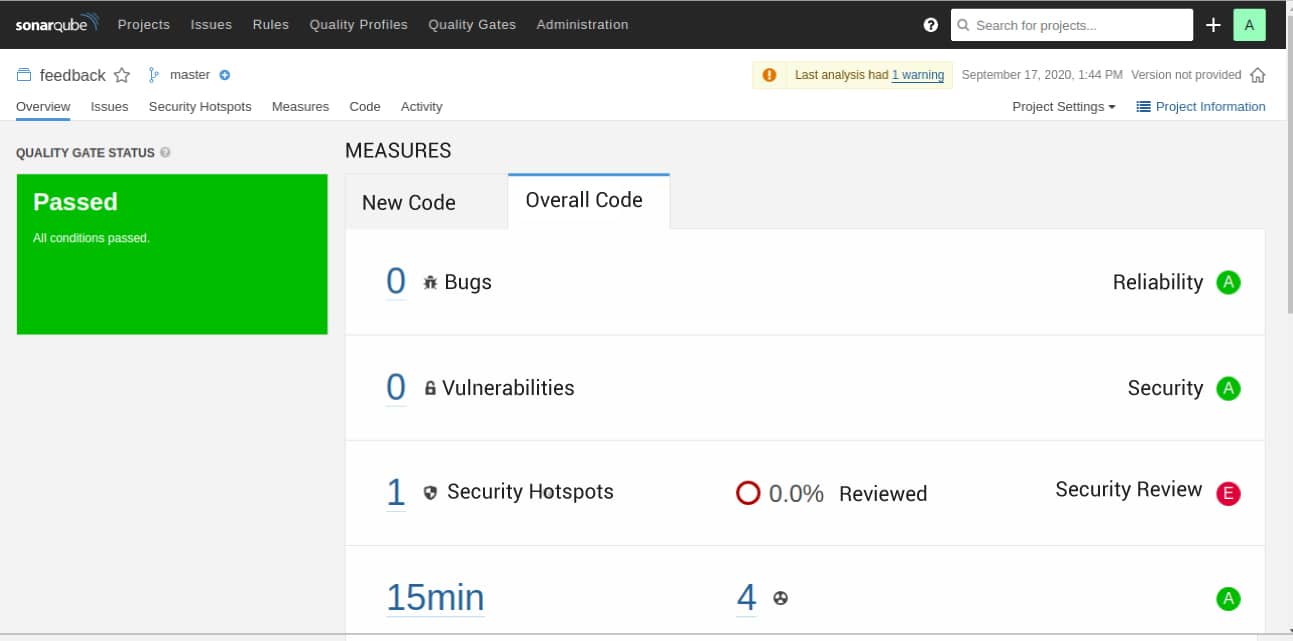
The detailed analysis of your code is available at localhost: 9000. Figure 11 shows that the analysis was passed and zero bugs, zero vulnerabilities, and one security hotspot were reported. There are four code smells and fifteen minutes of technical debt.
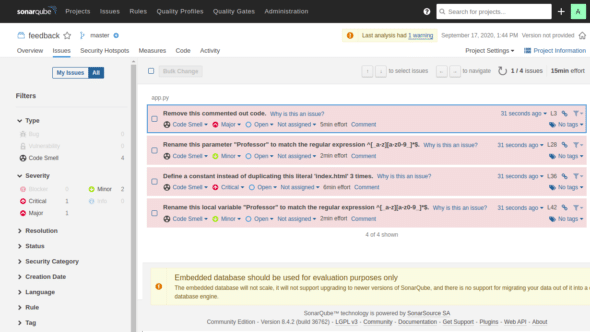
Some other details of bugs and vulnerabilities are shown in Figure 12. The left panel shows the categories like critical, major, minor, info, etc. This panel can be used for viewing different issues according to severity and type. There are other tabs like resolution, status, security category, etc, which can be used for viewing the ways of resolving issues, their status, category, and so on.
Results and discussion
Both Snyk and SonarQube generate a report after SAST analysis, on the basis of which we can update the code to resolve bugs and vulnerabilities. So, it is important to know how to use this report for best results. The report generally categorises the issues into ‘major’ and ‘minor’. Major issues need urgent assistance, while minor issues are mild issues that can be at a lower priority. The report displays the bugs, vulnerabilities, and security hotspots. These are the security-sensitive pieces of code that the developer needs to review manually. Code smells are listed to show the maintainability issues with the code. Technical debt or debt, which is the estimated time for reviewing and maintaining the code, is also shown. The report also gives ways to fix the issues, making life easier for any tester or developer.
With this article, we understood the importance of security in applications and of Static Application Security Testing or SAST in DevSecOps. We understood that various tools are available for SAST; for demonstration, we have used Snyk and SonarQube. These tools are open source, can be used for applications in various languages and provide user-friendly functions. We have used Snyk in two ways, and applied SonarQube Analysis on a Java and a Python application. we also understood some important terms in the report, using which we can fix the security problems in the code.


