Software applications have to undergo various tests to ensure quality. One such test is load testing, which helps to determine how the application behaves when multiple users or requests hit it simultaneously. Apache JMeter (JMeter) is one of the best open source tools for this job.
JMeter is an open source desktop based application for testing software. It is a pure Java application used for analysing and measuring the performance of software through a variety of graphical reports. We can perform load testing, stress testing and functional testing for applications with JMeter.
If there are any flaws in the application such as buffer overflow or memory leaks, JMeter can easily simulate the situation in your own environment and avoid production issue surprises. It can help achieve all this easily, even if you have minimum or no knowledge in coding.
Installation of JMeter
Detailed installation steps for Windows and Linux are given at https://jmeter.apache.org/usermanual/get-started.html, and for Mac at https://psychowhiz.medium.com/install-jmeter-on-mac-25531bc2b2ad.
The following are some of the types of applications that can be tested with this tool:
- Websites: HTTPS and HTTP
- Web services: REST, SOAP and Graphql
- Database servers
- FTP servers
- LDAP servers
- Mail servers: SMTP, POP3, IMAP
- TCP servers
Elements of JMeter
There are different elements in JMeter, each performing a task to achieve a goal. A few elements that are important are listed below.
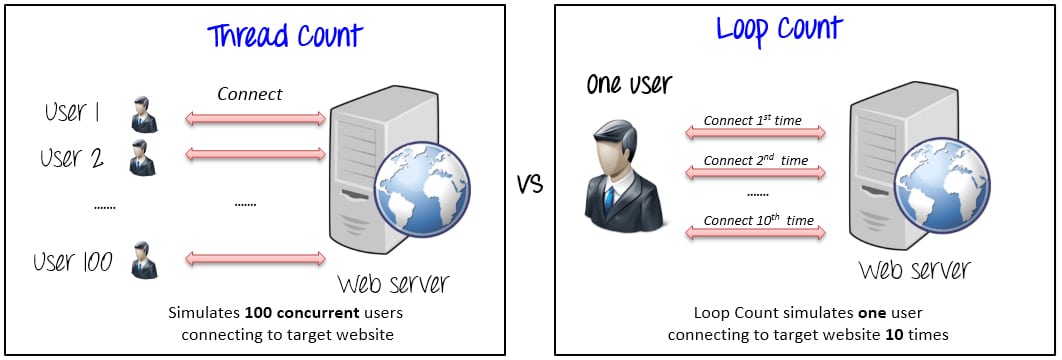
Thread group: This is a collection of threads, and each thread represents one user accessing the application in it. Ideally, it simulates one real user making one request to the application server. We can have multiple threads configured here.
Sampler: This is the type of request, such as FTP, HTTP, etc.
Listener: This shows the results in different formats.
Configuration: Sets up defaults and variables for later use by samplers.
Assertion: Validates whether a response from the server is expected or not.
Load testing
Prerequisites
First, we will test the Google home page.
- Open the installed JMeter.
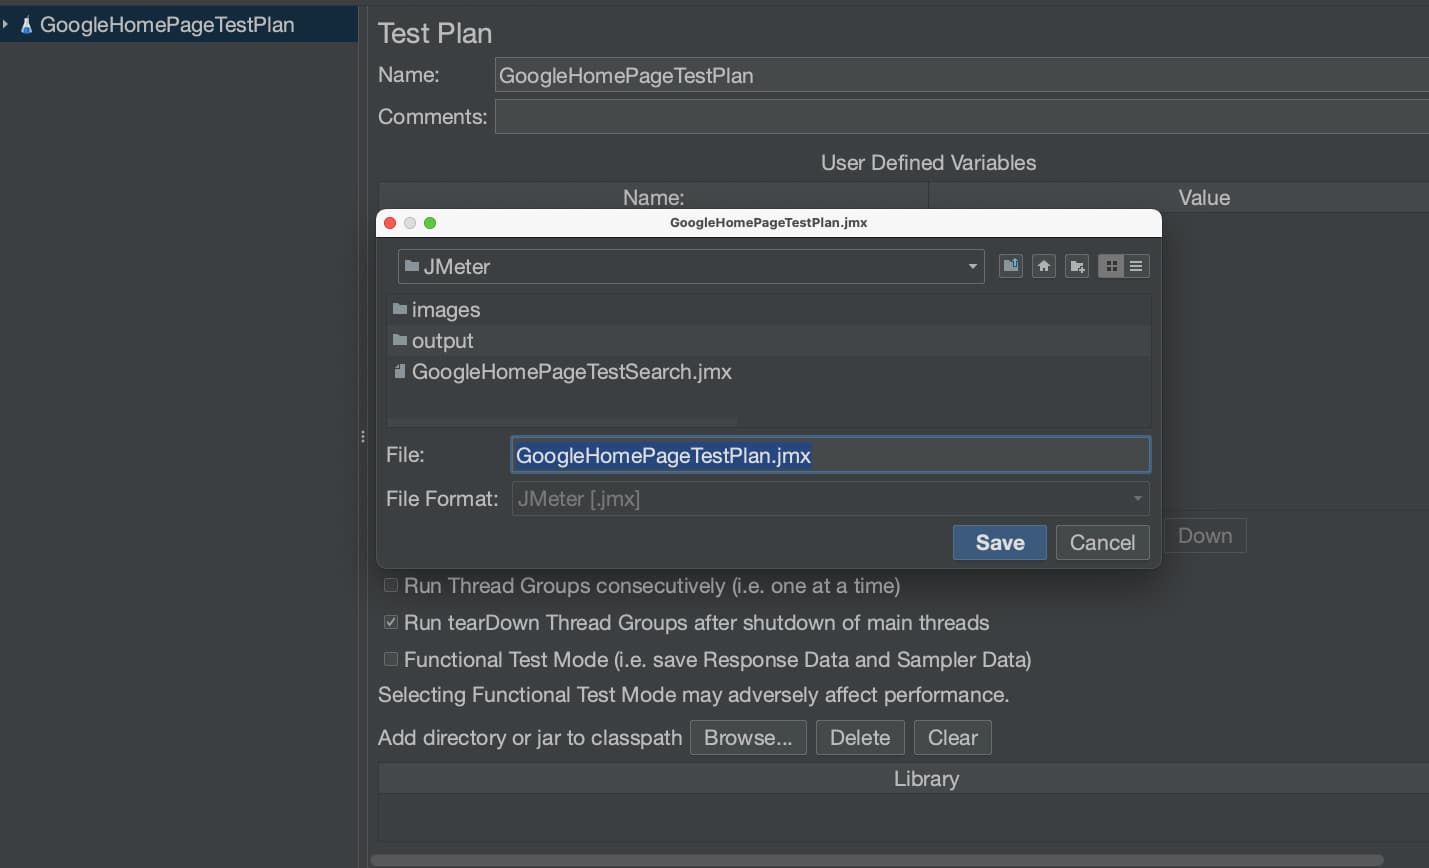
- Click on File -> New.
- Update the name to GoogleHomePageTestPlan.
- Click on Save Icon #; it will be saved as a .jmx file.
Step 1: Thread group
In the thread group, we need to know the following.
- Number of threads: ‘N’ number of users connecting to the target URL.
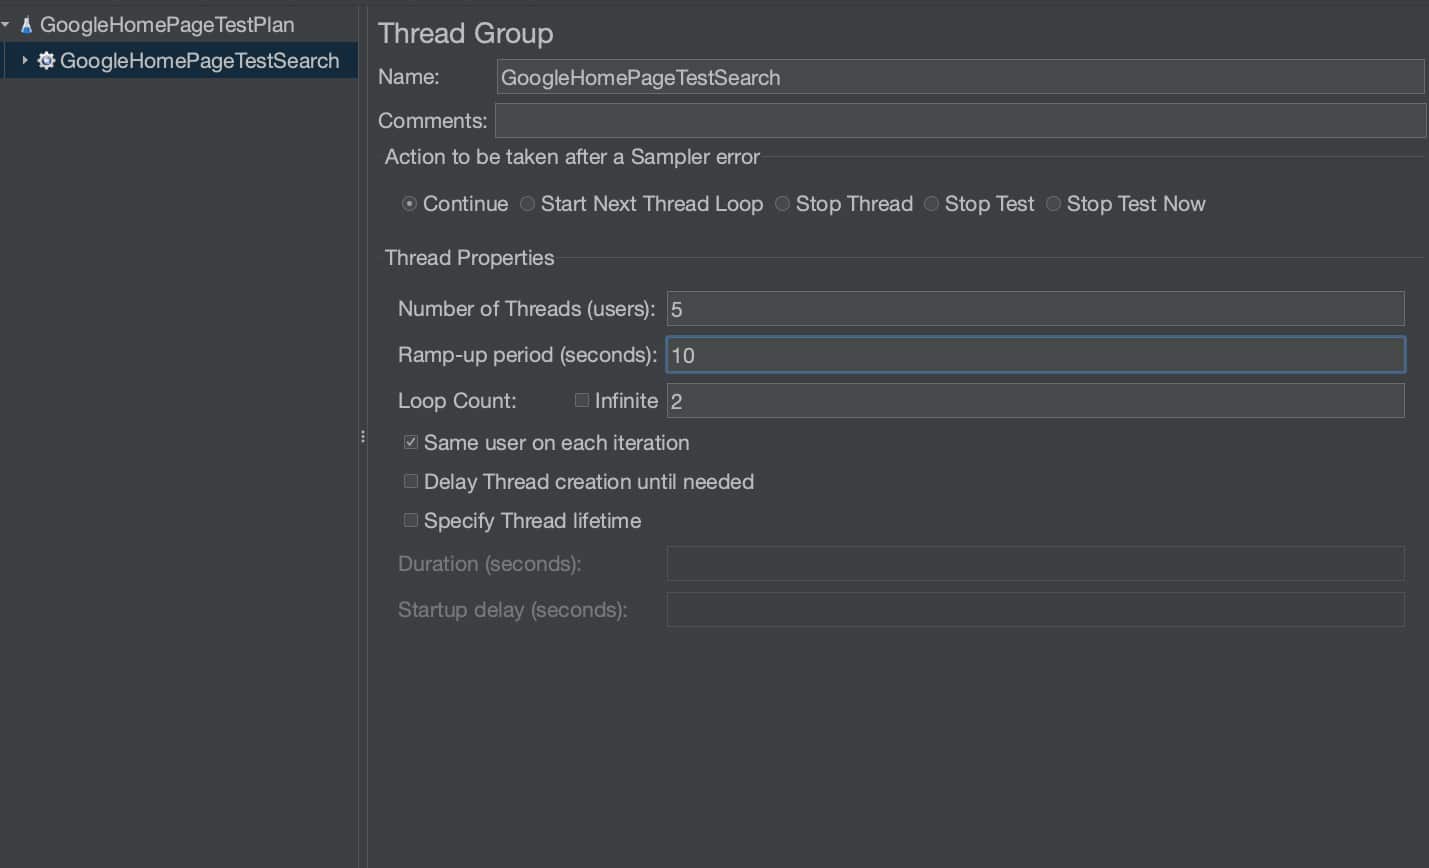
- Ramp-up period: This allows to include delay when requests hit the target. As an example, if we have 10 threads and 5 as the ramp-up period, the 10 requests should hit the target within 5 seconds with 0.5 second delay between each request. This is primarily used when we don’t want to overburden the server as well as the client. But if you want to do stress testing, try tweaking the property, based on the use case.
- Loop count: This is ‘N’ number of times the test case is to be executed; for example, if you have 5 threads and the loop count is 2, the request will hit the target 10 times.
Now, let’s carry out the steps.
- Right click GoogleHomePageTestPlan -> Add -> Threads (Users) -> Thread Group.
- It is a good practice to change the name, as readability matters. For this, update the name to GoogleHomePageTestSearch.
- Update Number of Threads (users) to 5.
| Note: Please do not update number of threads to more than 10. You may be blocked. |
Step 2: Sampler
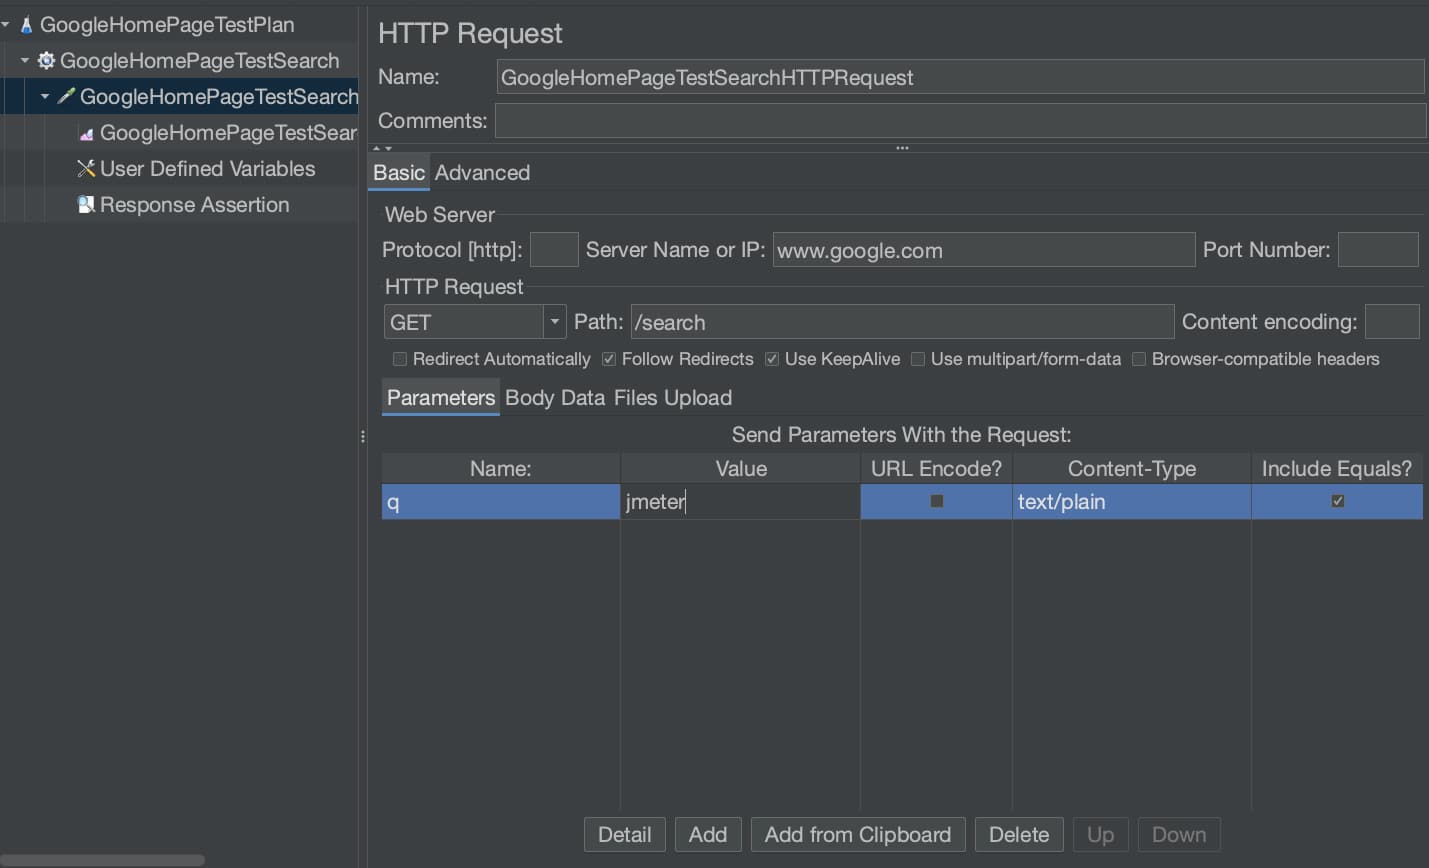
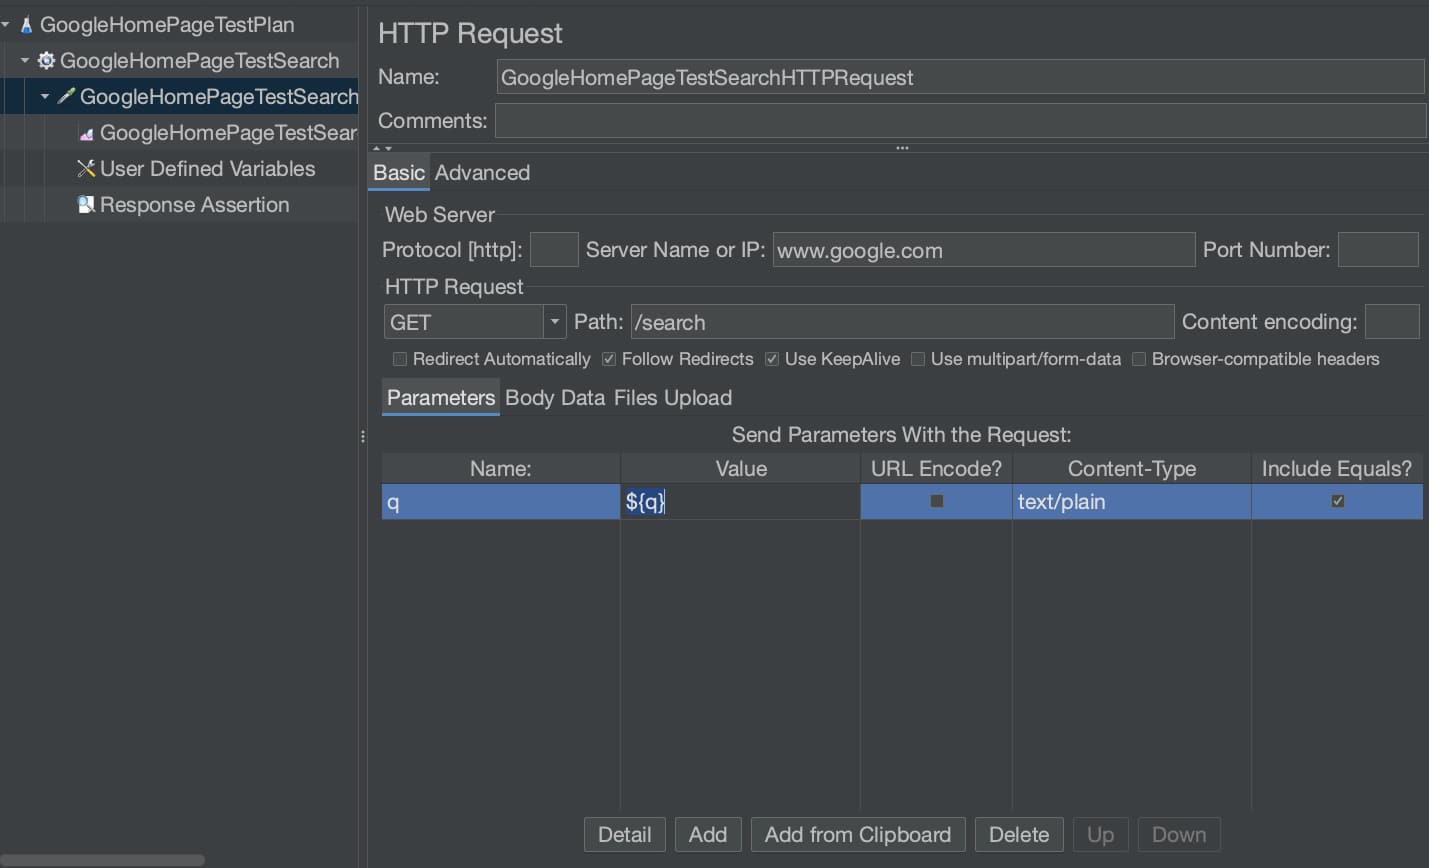
- Right click on GoogleHomePageTestSearch -> Add -> Sampler -> HTTP Request.
- Let’s rename again. Update the name to GoogleHomePageTest SearchHTTPRequest.
- Update the parameters given below:
- Server name of IP: www.google.com
- Port number: None [optional]
- Protocol (http): HTTP / HTTPS [optional]
- Method: GET
- Path: /search
- Parameters:
▪ Click Add
▪ Name: q
▪ Value: JMeter
- For POST method with JSON input:
- Under ‘Body Data’ give the JSON format input.
- If needed, you can add header details under ‘HTTP Header Manager’ and authorisation under ‘HTTP Authorisation Manager’. Both are under GoogleHomePageTestSearch -> Add -> Config Element.
- Step 3: Listener
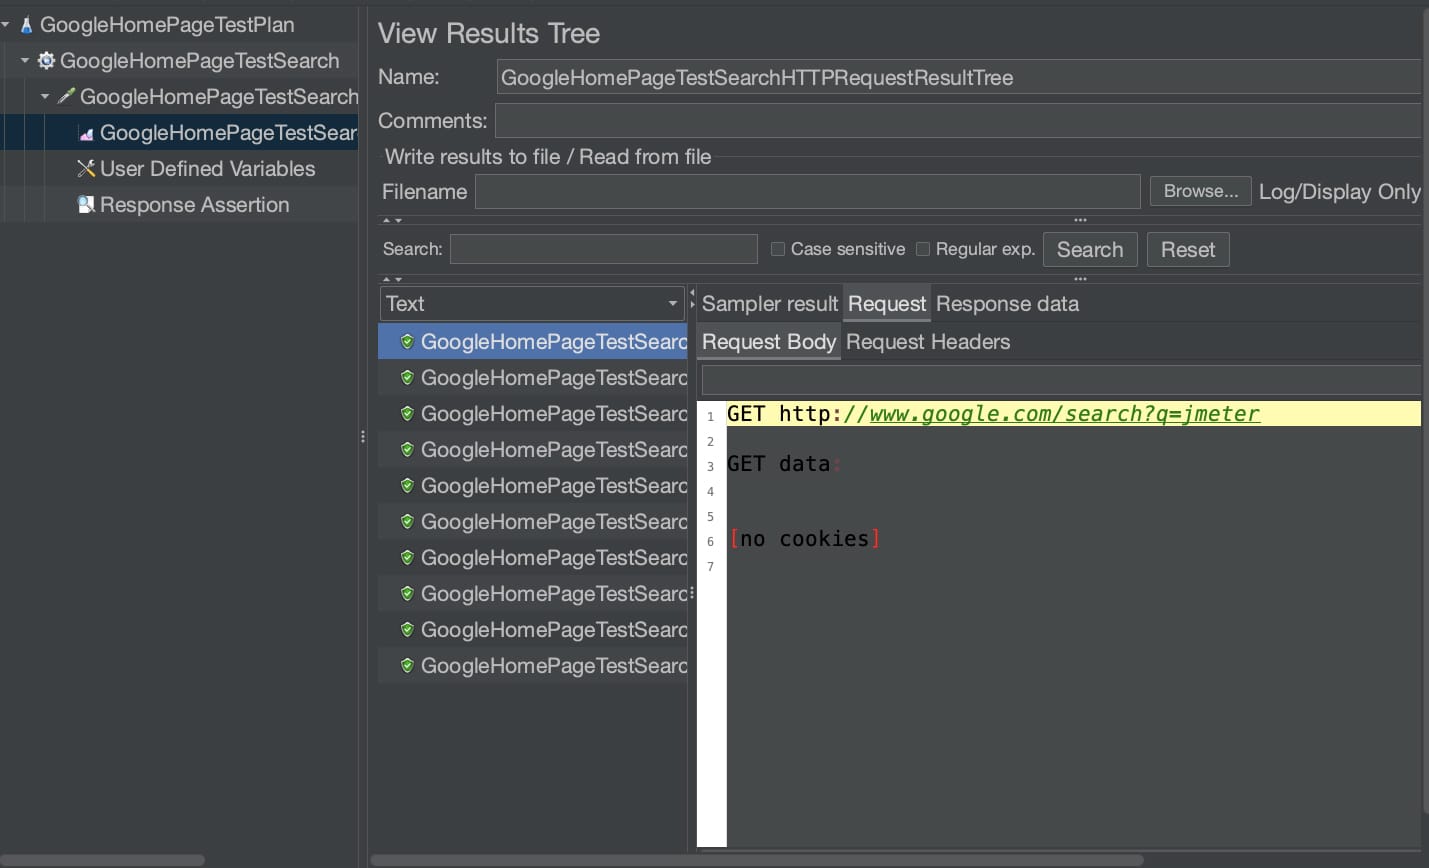
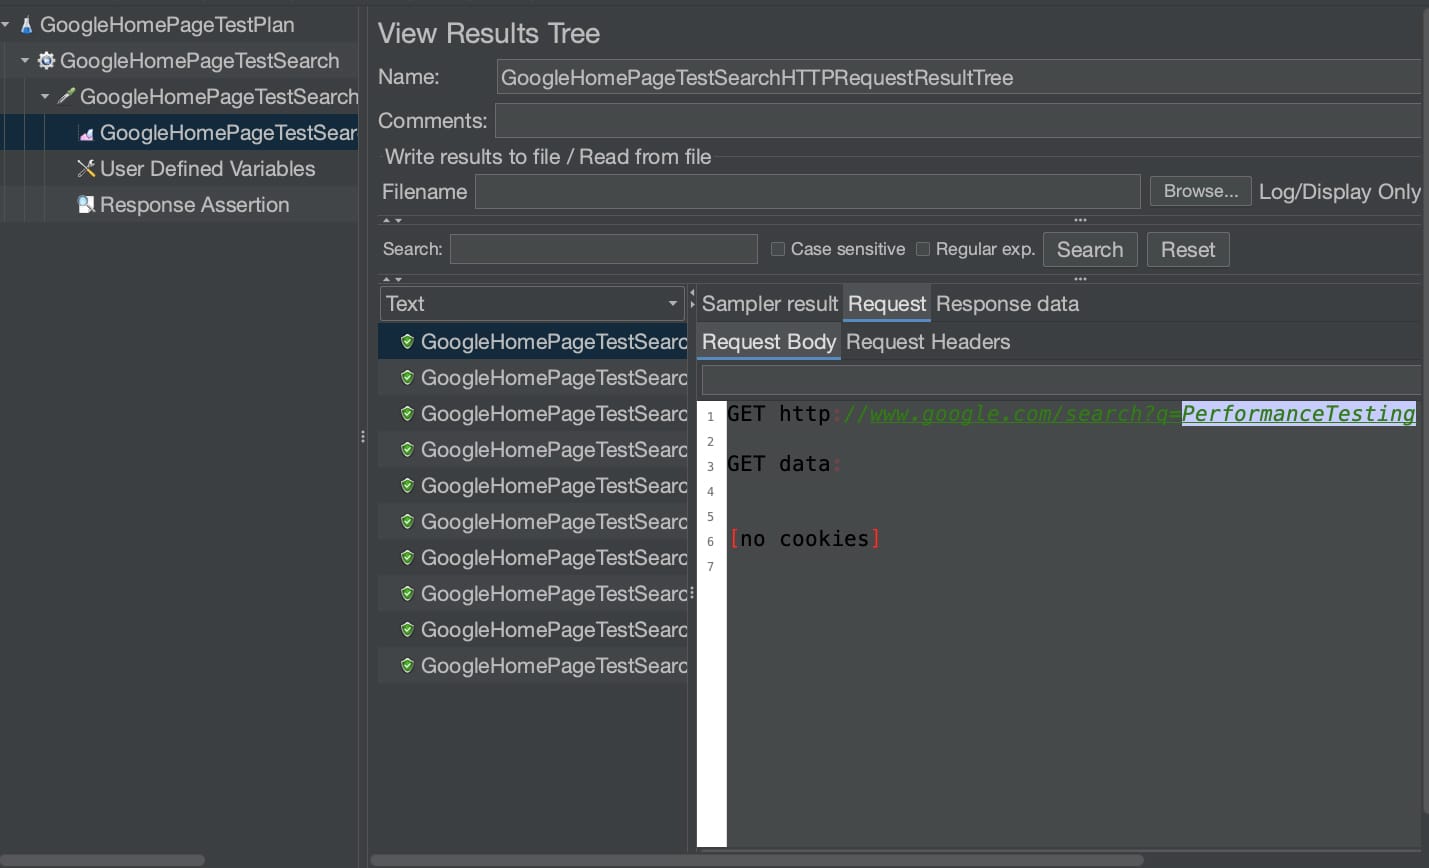
- Right click on GoogleHomePage TestSearchHTTPRequest -> Add -> Listener -> View Results Tree.
- Rename to GoogleHomePage TestSearchHTTPRequestResultTree.
- Click on Run -> Green Button.
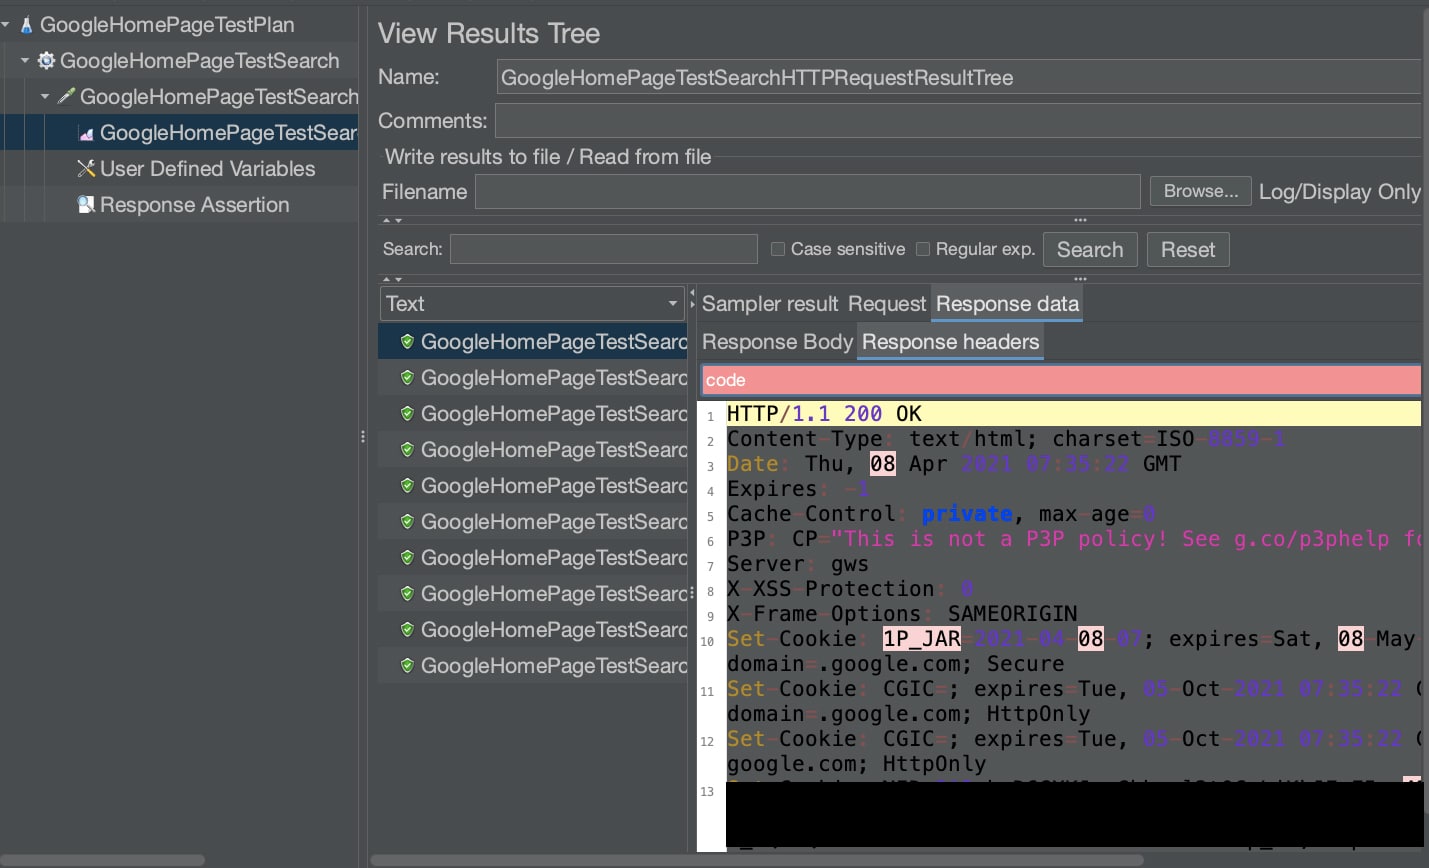
- View the results in Sampler result, Response data and Request.
- Different types of charts are available for crisp results. The link is: https://www.edureka.co/blog/load-testing-using-jmeter/ .
Step 4: Configuration [optional]
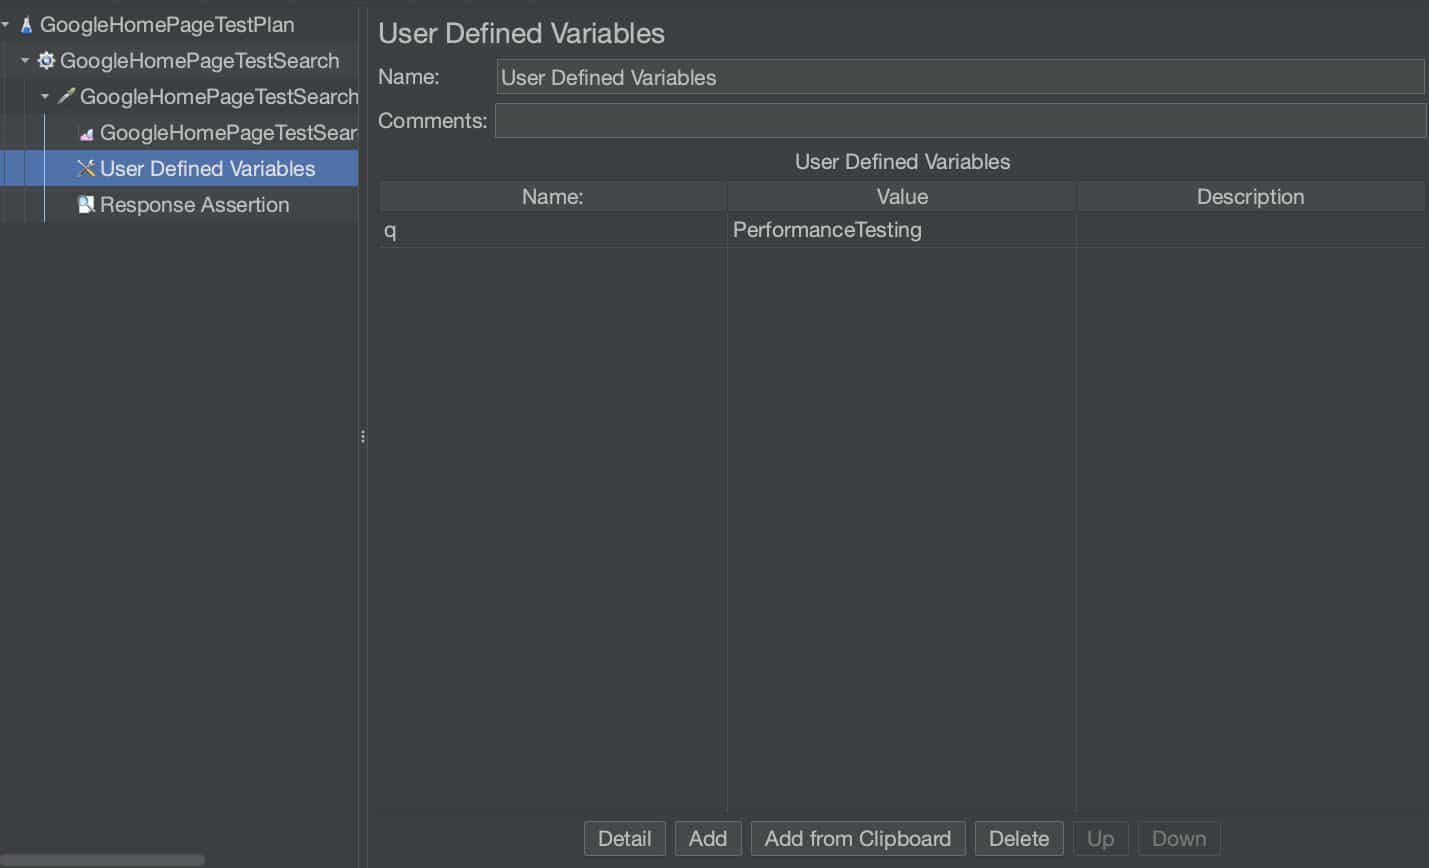
- Right click on GoogleHomePage TestSearchHTTPRequest -> Add -> Config Element -> User Defined.
- Set up the variables.
- Use the defined variable by enclosing it in ${<variable>}.
- Now check that ‘q’ is substituted with the defined variable and HTTP Request is also holding the ‘q’ value.
- The same format can be used while doing data driven testing, wherein you may want to induce dynamic values to the service. We need to configure the CSV data set Config under Config Element.
Step 5: Assertions
- The response assertion control panel lets you pattern strings to be compared against various fields of the request or response.
- Right click on GoogleHomePage TestSearchHTTPRequest -> Add -> Assertions -> Response Assertion
- Set up the validations, checking whether the Response Code is 200.
- The result is positive, as the Response Code is 200.
Bonus step: Record and run
- Let’s say we have many rest APIs to be tested in a single page and have to create many samplers manually, which can be tiresome. For example, in Amazon, several API hits are needed to form the home page, such as deals, products, bestsellers, user menu, etc.
- JMeter has a solution — record and run. A step-by-step example is shared at https://jmeter.apache.org/usermanual/jmeter_proxy_step_by_step.pdf.
| Note: The Firefox browser supports this feature. We just need to make sure we have access to update the settings in it. |
Command line
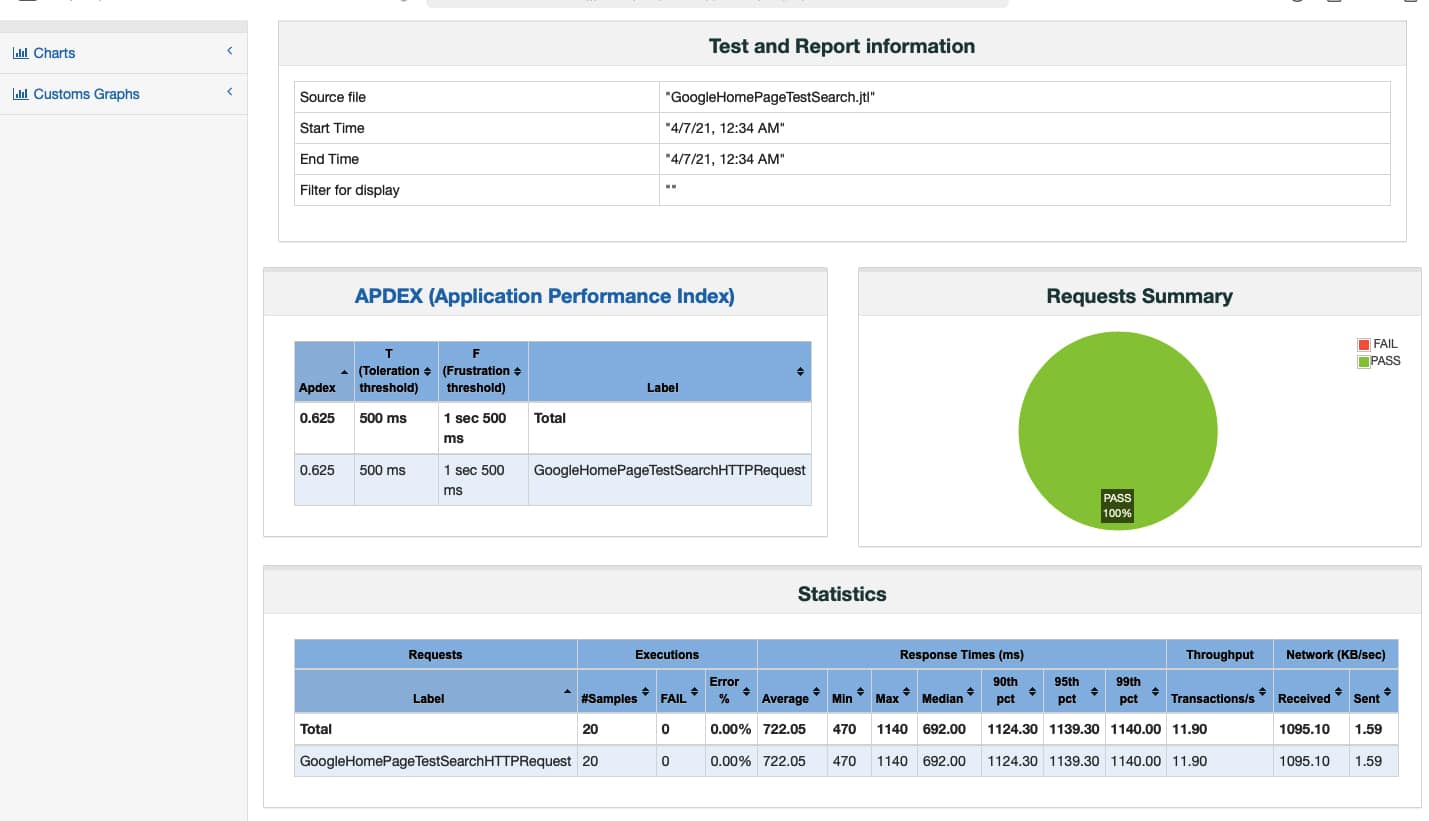
You can run JMeter from the command line and can have its output redirected to an HTML as well. The non-GUI mode brings in more flexibility when running heavy loads. But the configuration can still be done using the GUI, and the results can be analysed too.
A sample command is given below:
$ jmeter -n -t GoogleHomePageTestSearch.jmx -l GoogleHomePageTestSearch.jtl -e -o googletestoutput
◦ -n: to run in non-gui mode
◦ -t: name of JMX file having the Test Plan
◦ -l: Name of JTL(JMeter text logs) file to log results
◦ -e: generate report dashboard after load test
◦ -o: output folder where to generate the report dashboard after load test. Folder must not exist or be empty
The output is shown in Figure 11.

Benefits of JMeter
- Open source: JMeter is open source software, so there are no licensing costs
- Ease of use: It can be installed and used easily.
- Platform-independent: As JMeter is completely Java based, it is platform-independent and can run on multiple platforms.
- Customisable: Since JMeter is open source, developers can customise its source code as per their requirements. There is also a prescript and postscript execution process, where we can run customisable code in Java or Python.
- Data driven testing: The CSV data set Config allows you to read different parameters from the text file and convert them for making dynamic requests.
- Record and playback: JMeter provides record and playback options with a drag-and-drop feature. This makes it easier and faster to create scripts.
- Supports distributed load testing: JMeter supports distributed load testing features with which we can create a master-slave setup for carrying out load testing on multiple machines (https://jmeter.apache.org/usermanual/jmeter_distributed_testing_step_by_step.html).
- Good community support and documentation: JMeter has many online tutorials (I really like Edureka) and great community support. It also has freely available plugins that help in different aspects of script creation and analysis.
- Reporting: It helps to visualise test results, which can be displayed as a chart, table, tree, log file, etc.
Drawbacks of JMeter
- Passwords are saved as plain text, which is risky if the .jmx file is shared accidentally.
- It supports only Java or Java backed languages for custom coding.
Tools similar to JMeter are LoadView, LoadUI, NeoLoad, WEBLOAD, and LoadRunner.
JMeter is a popular and widely used tool for performance and API testing. Its feature list is exhaustive, and this article just gives a sample of its usage. The JMeter user manual, which has a detailed description of each of its features, can be found at https://jmeter.apache.org/usermanual/index.html.


