Elasticsearch, Logstash and Kibana together form the ELK Stack. Elasticsearch is a search and analysis engine. Logstash is a data collecting engine with capabilities of real-time pipelining, and Kibana is a user interface for visualising Elasticsearch data by creating graphs and charts. This article explains the process of analysing the logs generated by IT usage in a company.
Most IT resources generate streams of chronological messages called logs or audit trails that have information related to the systems’ activities. Logs are the most important assets for monitoring and managing various IT resources. They provide the information generated by the system, which is required to spot issues that might affect its performance. These logs record every action that has taken place on your IT resources (here, IT resources means computers, networks and any other IT systems). In every organisation, log analysis should be a part of infrastructure monitoring as it helps mitigate several risks at an early stage, and also helps meet compliance regulations.
How does log analysis work?
To analyse the logs from different IT resources such as network devices and programmable or smart devices, the following way is recommended.
1. Collect logs: First, collect logs from across your infrastructure in a central and accessible location, which you can do with a logging application called Log Collector. It’s easier to query and analyse logs from a single location.
2. Indexing: When collected at a central location, logs should be organised in a common format to ensure uniformity, to make them more understandable. They should also be indexed by this central location to make the data easily searchable for efficient log analysis.
3. Search and analyse: Logs can be searched by matching various patterns and structures such as those with a specific severity level or by exception. Using this search, reports and dashboards can be created to make information available to stakeholders. Of course, it is easier to spot trends by looking at graphs or other visual representations of data that you can view on your reports. These reports and dashboards make log analysis way more easy than going through the log files.
4. Monitor and set alerts: Alerts can be set up to notify you when any conditions are not met. This helps to avoid risks by detecting the root cause of the issues that impact the performance of your IT resources, enabling you to build appropriate counter measures. Triggers can also be configured based on alerts; for example, a webhook call can be triggered to restart a service if your service is not giving response.
The benefits of log analysis are:
- Reduces the time in troubleshooting and resolving issues in your systems.
- Improves the user experience and reduces customer churn.
- Helps in efficient use of IT resources.
- Improves security and compliance of IT systems.
Use cases of log analysis include:
- Troubleshooting issues in systems, networks and other IT resources.
- Meeting security policies and audits, and regulatory compliance.
- Understanding the behaviour of users in your systems.
- Understanding and responding early to any security incidents and data breaches.
- Rapid and early detection of failed processes.
- Improving the performance of IT resources.
Let’s now perform a log analysis with ELK Stack.
As stated earlier, ELK Stack is the acronym for three open source tools: Elasticsearch, Logstash and Kibana. Combining these three tools will provide you all the features required to perform log analysis.
1. Elasticsearch is a search and analytics engine. It stores and analyses the logs, security related events and metrics. It offers speed and flexibility to handle this data with the use of indexes.
2. Logstash is a tool for shipping, processing and storing the logs collected from different sources. It is a data collection engine with capabilities of real-time pipelining. It collects data from different sources, normalises it, and puts it in a stash called Elasticsearch.
3. Kibana is a user interface to visualise Elasticsearch data, and to create charts and graphs for efficient log analysis. Alerts can also be set in case of any issue.
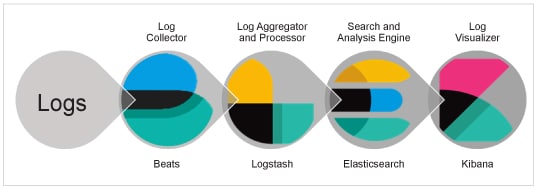
Figure 1 gives the basic architectural flow of these three components for log analysis.

In this figure, you can view the architectural flow as follows:
1. All the logs from various IT resources are first sent to the Log Collector.
2. In ELK, the log collection is different kinds of beats like heartbeat, filebeat, metricbeat, etc. These beats are configured based on which kind of data you want to check the status of for any service (heartbeat), getting logs from various log files (filebeat) or getting different metrics (metricbeat).These beats collect and send all these logs to Logstash.
3. Once the data is with Logstash, it aggregates and processes it, and stashes it to Elasticsearch for analysis.
4. Elasticsearch stores and analyses this data, and feeds the analysed data to the Kibana dashboard.
5. In the last step, Kibana visualises this data in some form of graph or chart by querying it as required by the stakeholders.
This is just the basic simple flow configured for learning purpose. But for production grade implementation, adding components like Redis, Kafka and RabbitMQ for resiliency is recommended.
Configuring ELK for log analysis
Considering the ELK Stack is already installed, we can directly configure log analysis to capture ngnix server logs from a Linux system. You can use this process for Apache logs as well. In a Linux based system, server logs are present under the /var/log directory and nginx logs are in the /var/log/nginx directory.
Follow the steps given below to configure ngnix logs in ELK.
1. First, install filebeat:
> curl -L -O https://artifacts.elastic.co/downloads/beats/filebeat/filebeat-7.12.0-linux-x86_64.tar.gz

> tar xzvf filebeat-7.12.0-linux-x86_64.tar.gz
2. Update the filebeat configuration file at location in <filebeat-directory>/config/filebeat.yml. Edit the Elasticsearch details as given below:
Config
output.elasticsearch:
hosts: [“your-elasticsearch-host:9200”]
username: “YOUR_ELASTICSEARCH_USERNAME”
password: “YOUR_ ELASTICSEARCH_PASSWORD”
Also, update the Kibana details as given below:
setup.kibana:
host: “your-kibana-host:5601”
username: “YOUR_KIBANA_USERNAME”
password: “YOUR_ KIBANA_PASSWORD”
Then save this config file.
3. Now, to add ngnix as a module to filebeat run the following command:
> ./filebeat modules enable nginx
4. Update module settings in module configs under modules.d to match your environment. If your logs are in different locations, then set the paths variable:
Configs
- module: nginx
access:
var.paths: [“/var/log/nginx/*.log”]
Save <em>configs.</em>
5. Now execute the command given below to set up filebeat to take this configuration and download all the required plugins:
> ./filebeat setup –e
6. And now we start the filebeat with the commands given below:
> sudo chown root filebeat.yml
> sudo chown root modules.d/system.yml
> sudo ./filebeat –e
Once filebeat is started, it should begin streaming events to Elasticsearch.
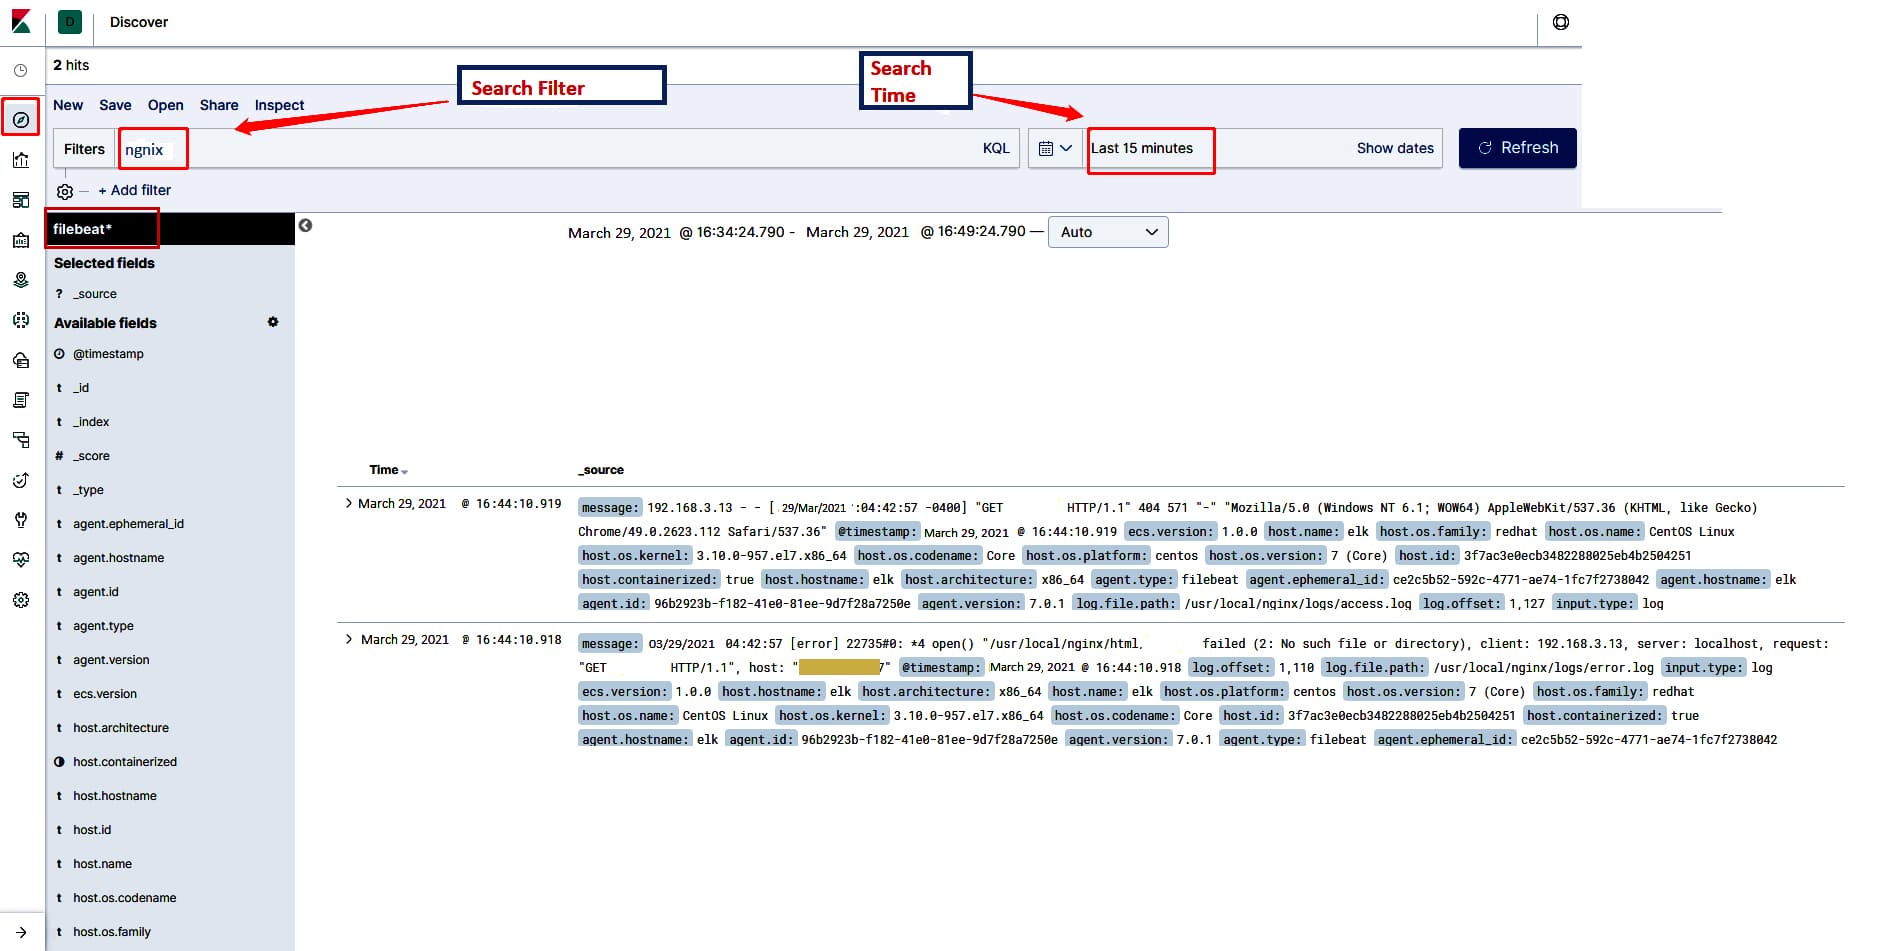
7. We can now view the logs on Kibana, in your browser (http://your-kibana-host:5601). When you go to Left Panel πDiscover πfilebeat-*, you should be able to view all the logs, as shown in Figure 2.

This is how you can configure server logs in the ELK Stack. You can also customise the Logstash config to further process these logs.
Benefits of ELK Stack
- ELK Stack works best when logs from various applications are collected into a single ELK instance.
- It provides amazing insights in a single instance, which eliminates the need to go through numerous different log data sources.
- Easy to scale.
- Libraries for different programming languages are available.
- It provides extensions to connect with other monitoring tools.
- Provides a pipeline mechanism to process logs into the format you want.
Drawbacks of ELK Stack
- It can become difficult to handle these different components in a stack when we move to a complex setup.
- You need to keep scaling, as your infrastructure and size of logs increases continuously.


