


Observability is an advanced way to monitor, analyse and track systems and services proactively. The cloud workspace is a modern, secured, quick and cost-effective remote workspace. It is wise to use native services to build observability frameworks for the cloud workspace. This article gives a blueprint for cloud workspace observability and the patterns to consider when designing solutions for it.
A cloud workspace is a cloud based desktop service. Typically, it is offered as an IT service on a subscription basis for enterprises. Cloud workspaces provide the following benefits to organisations
- Enable the workforce to work remotely from anywhere, anytime
- Comply with enterprise security policies and control data loss
- Allow and manage BYOD (bring your own device) at scale
- Scale workspaces up and down to meet dynamic demands
- Reduce costs in providing desktops
- Improve IT agility with centralised management and governance
Hyperscale vendors such as Microsoft, AWS, Google, and IBM offer cloud based desktop services from their well-established global cloud centres.
Observability
Observability is a measure of how well the internal states of a system can be inferred from the knowledge of its external outputs. Observability designs focus on:
- How quickly the IT team is notified when something is wrong or beginning to fail
- How rapidly the IT team can triage the problem, understand its impact and effectively provide any mitigation
- Effectiveness of the IT team in finding the underlying cause and fixing it
Observability includes contextual telemetry, dynamic service topology discovery, anomaly detection, proactive issue avoidance, alert grouping, correlation, root cause identification, advice on next best action, visualisation of the severity of business impact, and cost optimisation.
Observability patterns for cloud workspaces
Enterprises are adopting cloud services to take advantage of the benefits they promise. Observability frameworks help to measure the actual business value (in terms of reliability, cost, quality of service, etc) enterprises achieve from cloud adoption. The cloud workspace observability framework should be designed keeping in mind an enterprise’s business goals. The primary patterns that the cloud workspace observability framework should deploy are listed below.
Service reliability and health monitoring patterns: Insights into the health of workspaces is important. Availability, responsiveness, user experience measures are major items to be monitored.
Service reliability engineering (SRE) golden signals define what it means for the service to be healthy. Workspace service observability should monitor below golden signals in the context of desktop service.
- Latency: This is the time taken to serve a request. The duration a service takes to make the desktop ready to use from the time of the desktop request event is provision latency. Round trip time (RTT) is the network latency.
- Traffic: This is the stress due to the demand on the system. This signal is critical for desktop brokering, session gateway and other service mediation services.
- Errors: This is the rate of requests that are failing. Connection failures fall under this category.
- Saturation: This is the overall capacity of the system. This signal becomes critical for multi-session desktops, where a single virtual machine is shared among many users. Host server CPU, RAM utilisation, and queue depth fall under this category.
Security and governance patterns: Data security is a prime concern for enterprises, especially in remote working. Suspicious behaviour such as unusual access times, unusual locations, numerous logon failures, unusual file downloads, excessive authentication failures, abnormal permission changes are some sample threat signals that need to be monitored in real-time and acted upon immediately. Well-architected frameworks implement security patterns to combat such attacks and improve the cloud security posture. Patterns such as zero trust, role based permissions, conditional and contextual access, multi-factor authentication, multi-layer granular controls are some of the important ones that workspaces should adopt. The framework should ensure that these patterns are applied properly. To ensure real-time traffic monitoring and threat detections, observability frameworks should adopt AI/ML algorithms. These patterns have been quite visible in recent times with cloud native security information and event management (SIEM) solutions.
Cost optimisation patterns: Enterprises migrate to the cloud for leveraging opex and flexible commercial models. But if there is no judicious control over the cloud resource usage, the result could be frustrating. Cloud commercials are based on actual resource usage. It is the IT team’s responsibility to monitor resource usage and shutdown or release unnecessary resources. Choosing an optimal billing model is also very important. An observability framework should monitor resource usage and provide guidance on the optimal approach. It should implement cost optimisation patterns such as auto scaling, optimal charge model switching, auto stopping, etc.
Automation patterns: Observability patterns demand real-time discovery and automated orchestration of analysis and healing logic. They help in immediate reaction, and avoid human errors and delays. To help enterprises in achieving these goals, all public cloud vendors recommend well-architected cloud native automation patterns for best results. For example, serverless functions are best suitable for deploying automation patterns.
Traditional on-premises workspaces deploy isolated tools to observe these patterns. Each tool deploys data collection agents, telemetry middleware, data crunching frameworks, AI/ML algorithms, data visualisation consoles, and back-end server infrastructure setups. But most public cloud vendors provide SaaS services for many of these functions. These services simplify workspace observability framework deployment in the cloud.
Blueprint for cloud workspace observability
Figure 1 shows a typical cloud workspace observability blueprint.
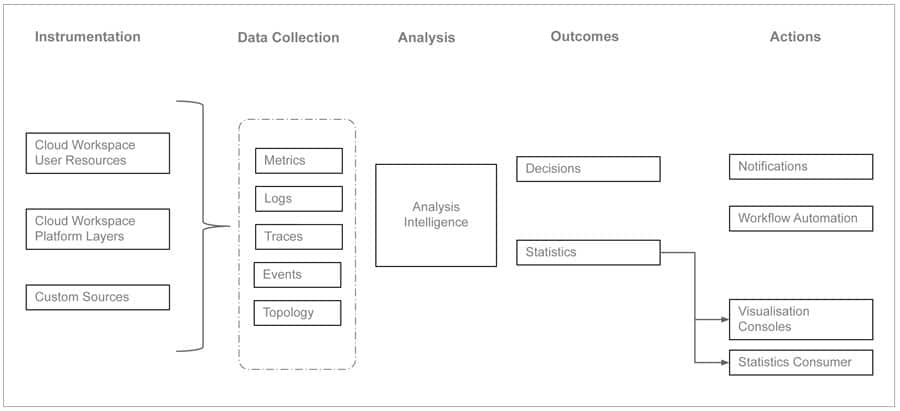
Instrumentation should be built into every workspace resource and control layer to collect telemetry data. Telemetry data could be related to metrics, logs, traces, topology discovery and predictions.
Metrics that are important for workspace observability include connection attempts, session launch times, in-session latency, and desktop resource metrics (CPU, memory usage, storage performance).
Logs that are relevant for workspace observability are admin activity logs, active directory activity logs, session host logs, platform diagnostic logs, key vault logs, etc.
Traces show the activity for an individual transaction or request as it flows through an application. They are a critical part of observability as they provide context for other telemetry.
Service topology and dynamic discovery of service components are essential elements in the observability blueprint. Predictions made from historical data can also become a very useful input.
Observability frameworks can be implemented using cloud native tools or open source tools, or a combination of the two.
Sample illustration leveraging cloud native tools
Table 1 summarises the native tools available with public cloud vendors to facilitate observability functions and patterns.
| Function | AWS WS | Microsoft AVD |
| Monitoring | Cloud Watch, Cloud Trail, Systems Manager | Azure Monitor |
| Cost optimisation | Cost Optimiser | Advisor |
| Security | AWS Security Hub, Cloud Trail | Sentinel, Security Center |
| Serverless automation | Lambda | Azure Function |
| Deployment automation (IaC) |
Resource Manager | Azure Resource Manager |
| Artifacts storage | S3 Bucket | Blobs |
Table 1: Cloud native tools available with public cloud vendors
Let’s now look at how to make use of cloud native services to build an observability framework.
AWS Workspaces is a managed desktop-as-a-service to provision Windows or Linux desktops. In a typical enterprise environment, some desktops are assigned to users, but they do not use them often. This leads to unnecessary costs to the company. Here is a sample solution to check the unused workspaces on a periodic basis and trigger actions to handle them. Figure 2 shows the deployment architecture.
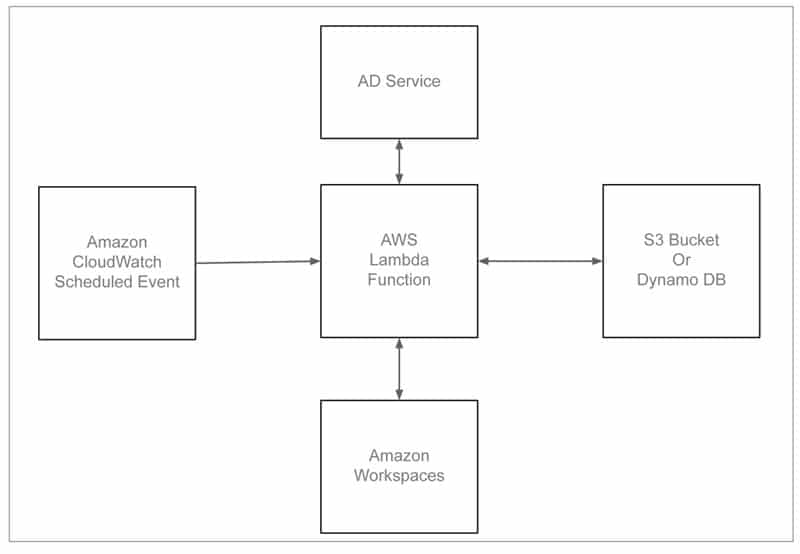
The solution deploys Amazon Cloud Watch event rules that invoke an AWS Lambda function periodically, say for every seven days. This Lambda function checks each workspace usage. If the workspace is not used for the specified threshold duration, an action is triggered. Action could be either notifying the administrator or even de-provisioning the workspace.
To implement a comprehensive observability framework, we need to ingest and analyse logs, metrics, and traces generated by the system components and services. To handle voluminous data streams, we can make use of other cloud native services such as AWS Kinesis Firehose and data stream services.
Open source tools to complement cloud native tools
Many cloud vendors provide workspaces as a fully managed service with native monitoring tools. However, there are a few use cases like cloud vendor-agnostic monitoring, enterprise customised monitoring, multi-cloud and hybrid cloud monitoring where enterprises have to look for other external tools. There are a few popular open source tools that support these use cases as well and are a better choice from a cost point of view.
Prometheus is a popular open source tool used for event monitoring and alerting. It records real-time metrics using http pull from targets. It provides flexible queries and real-time alerting. Prometheus can be integrated with the cloud workspaces ecosystem. Figure 3 illustrates a sample integration of Prometheus with AWS Workspaces. Exporter jobs and services can be instrumented to pull metrics from workspace targets. Platform service metrics can be pulled from Cloud Watch and Cloud Trial services.
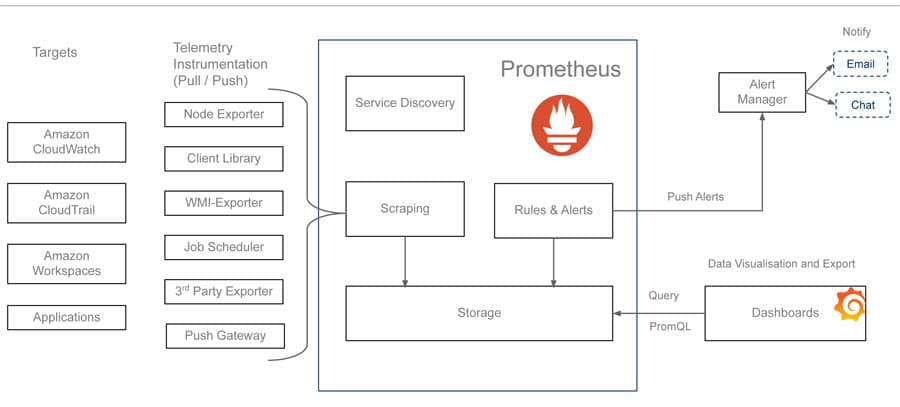
Grafana is a popular open source dashboard and visualisation tool with support for Prometheus as a data source. Granular dashboards can be prepared to monitor regional and departmental task based workspaces. Alerts can be configured in Prometheus by specifying a condition that needs to be maintained for a certain duration in order for an alert to trigger. When alerts are triggered, they are forwarded to the alert manager service. Alert managers can include logic to forward these alerts to email, Slack, teams, or notification services such as PagerDuty.
Other popular open source tools include Istio and Jaeger. Istio supports different types of telemetry (metrics, distributed traces, and access logs) in order to provide overall observability. Jaeger is a tracing system that supports the open tracing standard. It enables distributing tracing, root cause analysis and service dependency analysis.
Beyond observability
Native observability patterns provide visibility based on external factors. To get visibility into internal conditions, we will still need custom third-party tools. These tools deploy custom agents to gather specific data and provide detailed visualisation patterns. For example, to observe performance of applications running inside a desktop, we need to deploy additional application-specific custom agents.
In addition, we should also look at applying chaos engineering principles, which help to attain consistent workspace service reliability by hardening services against failures.


