


Zeek is an open source network security monitoring tool. This article discusses how to integrate Zeek with ELK.
In the article titled ‘Network Security Monitoring Made Easy with Zeek’ published in the March 2022 edition of this magazine, we looked into the capabilities of Zeek and learned how to get started with it. We will now take our learning experience a bit further and see how to integrate it with ELK (also know as Elasticsearch, Kibana, Beats, and Logstash).
For this, we will use a tool called Filebeat, which monitors, collects and forwards the logs to Elasticsearch. We will configure Filebeat with Zeek, so that the data collected by the latter will be forwarded and centralised in our Kibana dashboard.
Installing Filebeat
Let’s first set up Filebeat with Zeek. To install Filebeat using apt, give the following command:
sudo apt install filebeat
Next, we need to configure the .yml file, which is present in the etc/filebeat/ folder:
sudo nano /etc/filebeat/filebeat.yml
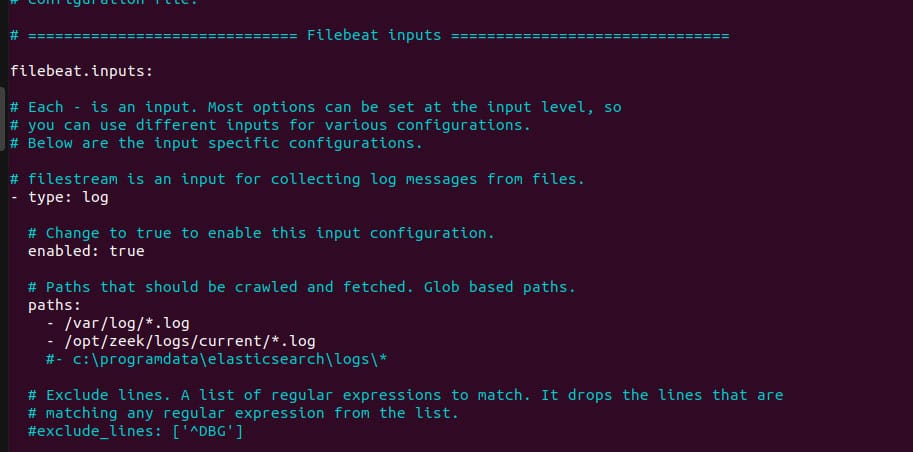
We need to configure only two things here. In the Filebeat Input section, change the type to log and uncomment the enabled: false and change it to true. We also need to specify the path of where the logs are stored, i.e., we need to specify /opt/zeek/logs/current/*.log
Once this is done, the first part of the settings should look similar to what’s shown in Figure 1.
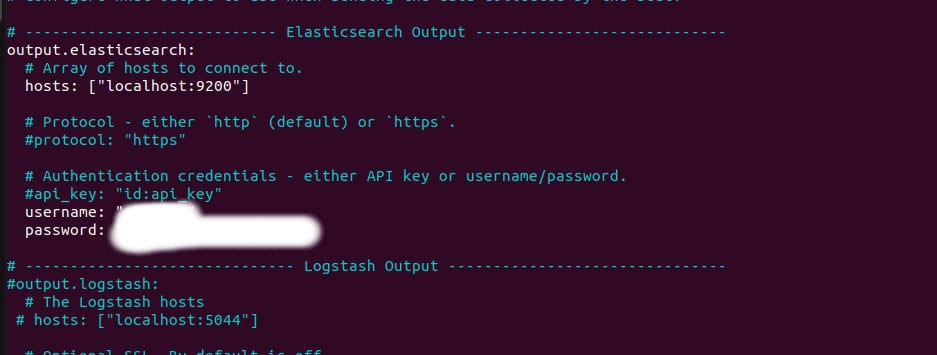
The second thing to be changed in the Elasticsearch output section is under Outputs. Uncomment the output.elasticsearch and hosts. Make sure the URL of the host and port number are similar to what you configured while installing ELK. We kept it as localhost with port number 9200.
In the same section, uncomment the user name and password at the bottom, and enter the user name and password of the elastic user that you generated while configuring ELK after installation. Once this is done, refer to Figure 2 and check the settings.
Now that we have completed installing and configuring , we need to configure Zeek so that it stores the logs in JSON format. For that, ensure your Zeek instance is stopped. If it’s not, execute the command given below to stop it:
cd /opt/zeek/bin
./zeekctl stop
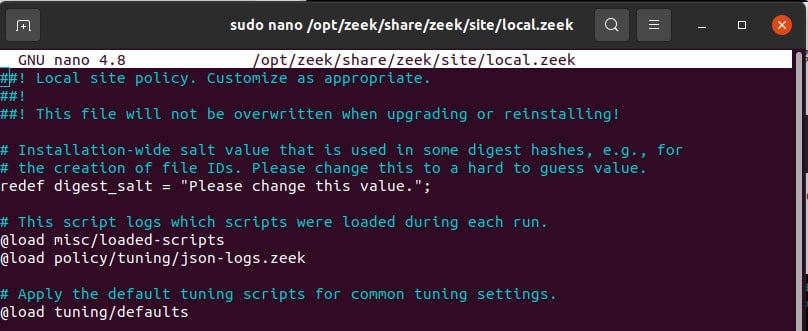
Now we need to add a small line in the local.zeek, which is present in the opt/zeek/share/zeek/site/ directory.
Open the file as root and add the following line:
@load policy/tuning/json-logs.zeek
Refer to Figure 3 and make sure the settings are done correctly.
As we have changed a few configurations of Zeek, we need to re-deploy it, which can be done by executing the following command:
cd /opt/zeek/bin
./zeekctl deploy
Now we need to enable the Zeek module in Filebeat so that it forwards the logs from Zeek. Execute the following command:
sudo filebeat modules enable zeek
We are almost ready; in the last step, configure the zeek.yml file to mention what type of data is to be logged. This can be done by modifying the /etc/filebeat/modules.d/zeek.yml file.
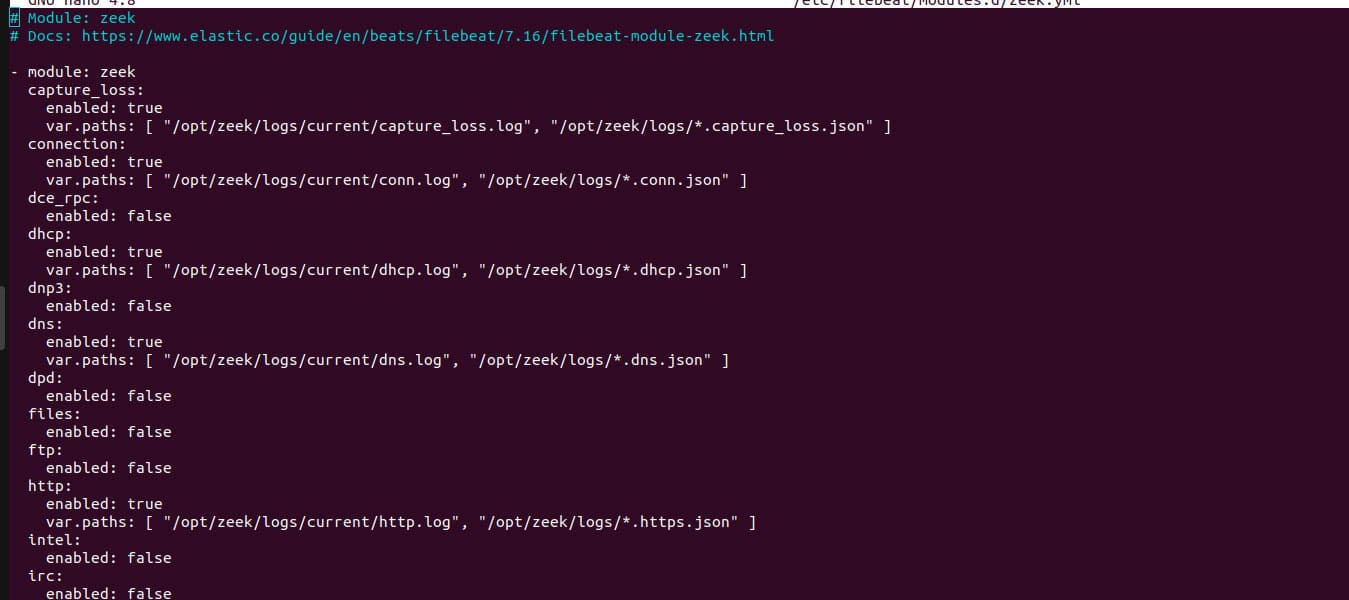
In this .yml file, we must mention the directory where these specified logs are stored. We know that the logs are stored in the current folder, which has several files like dns.log, conn.log, dhcp.log, and many more. We need to mention each path in each section. You can leave unwanted files by changing the enabled value to false, if and only if you don’t want logs from that file/program.
For example, for dns, make sure the enabled value is true and the path is mentioned as:
var.paths: [ “/opt/zeek/logs/current/dns.log”, “/opt/zeek/logs/*.dns.json” ]
Repeat this for the rest of the files. We did this for a few that we needed. We added everything that was mainly required. You can do the same. Refer to Figure 4.
Now it’s time to start the Filebeat. Execute the following commands:
sudo filebeat setup
sudo service filebeat start
Now that everything is done, let’s move to our Kibana dashboard and check whether we are receiving the data from Zeek via Filebeat or not.
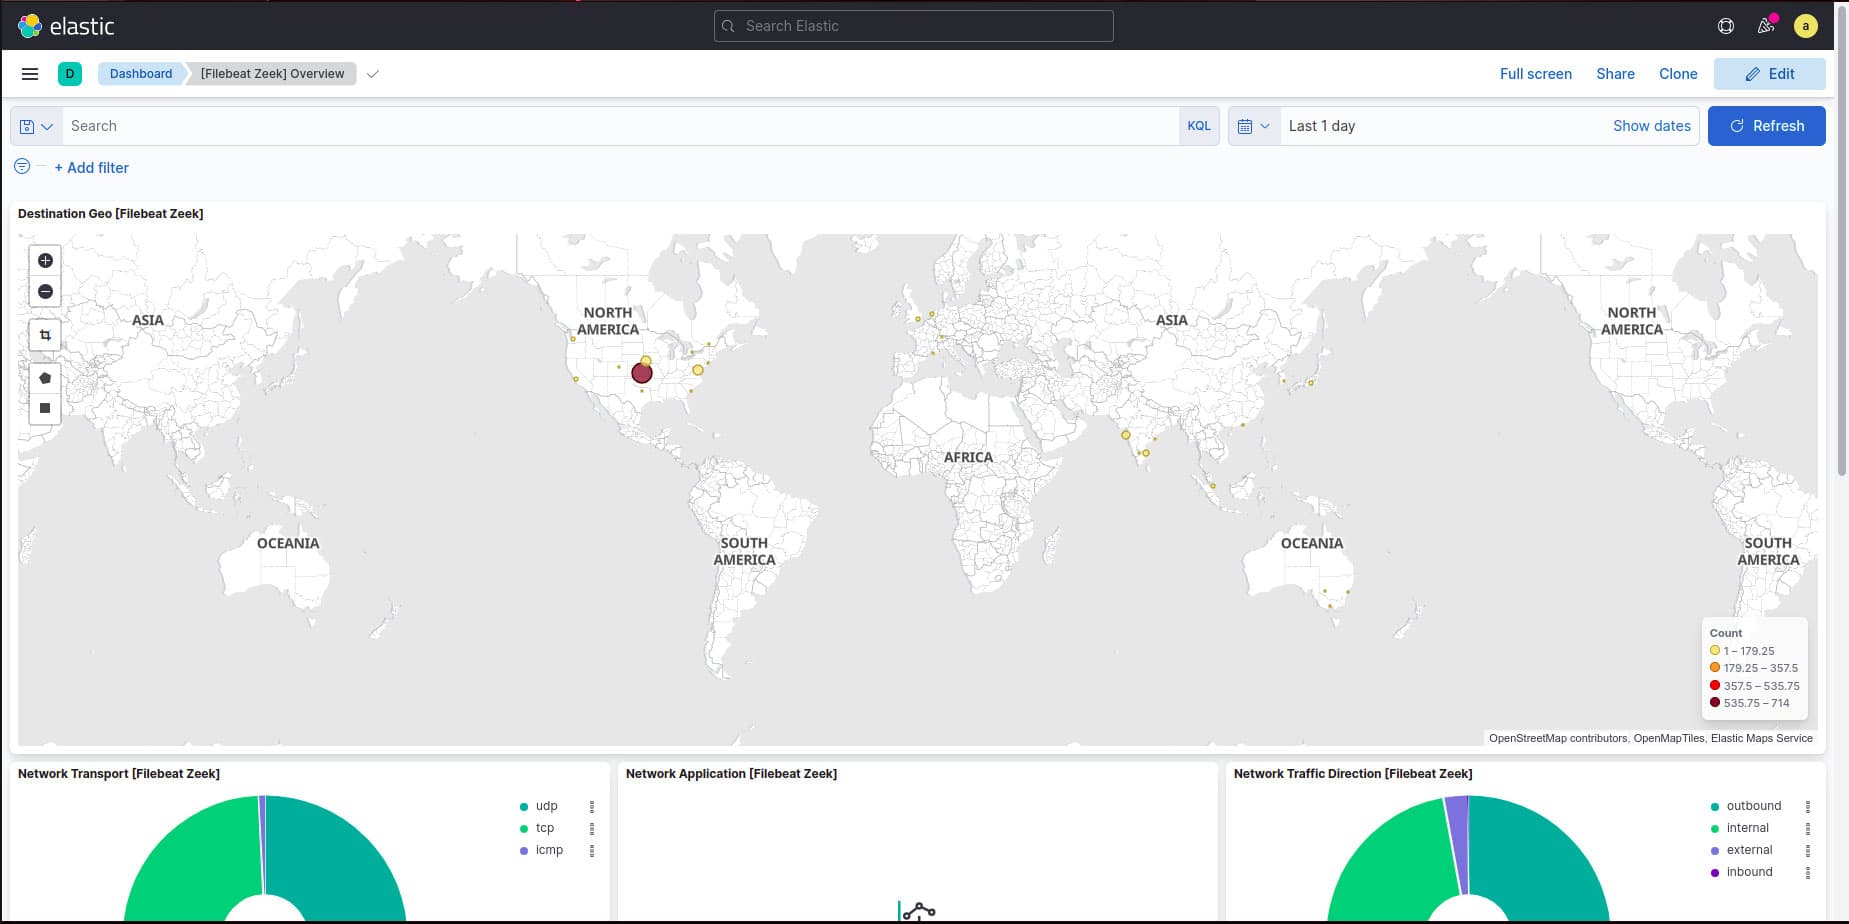
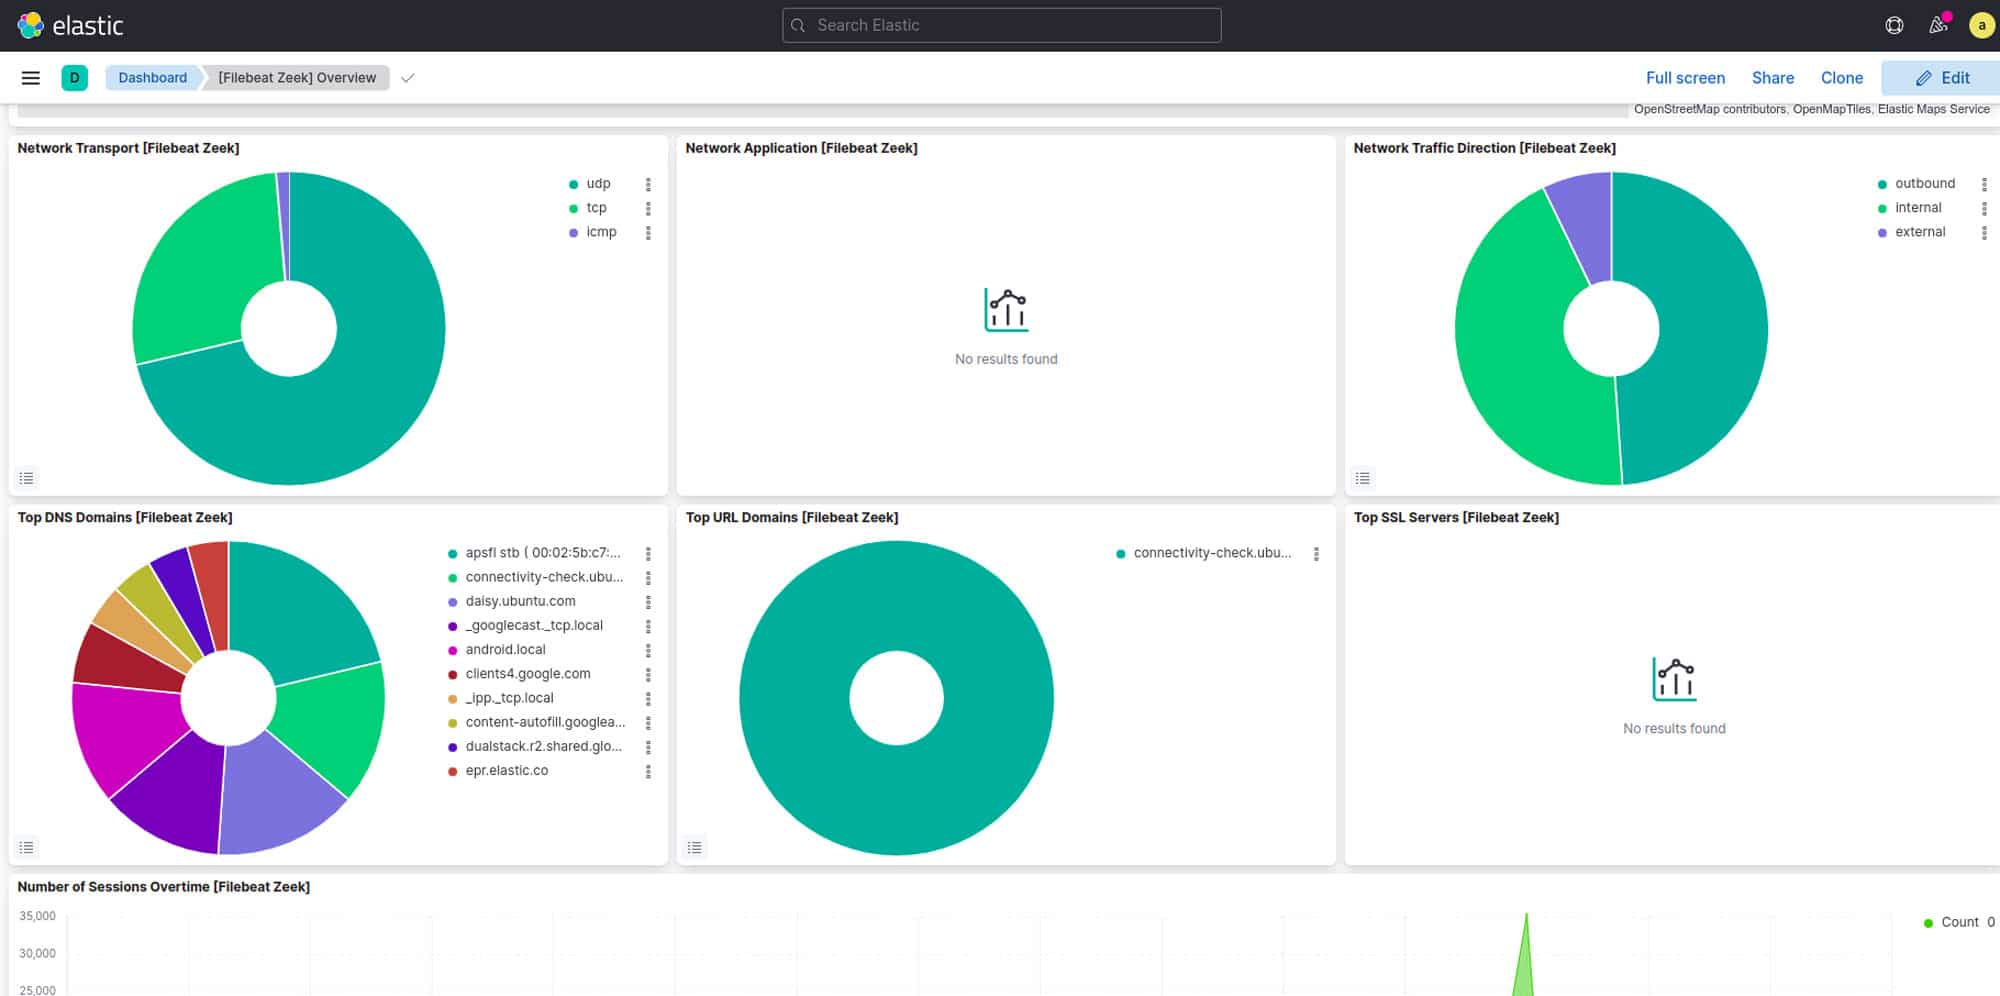
Navigate to the dashboard; you can see a clear statistical analysis of the data it has captured (Figure 5 and Figure 6).
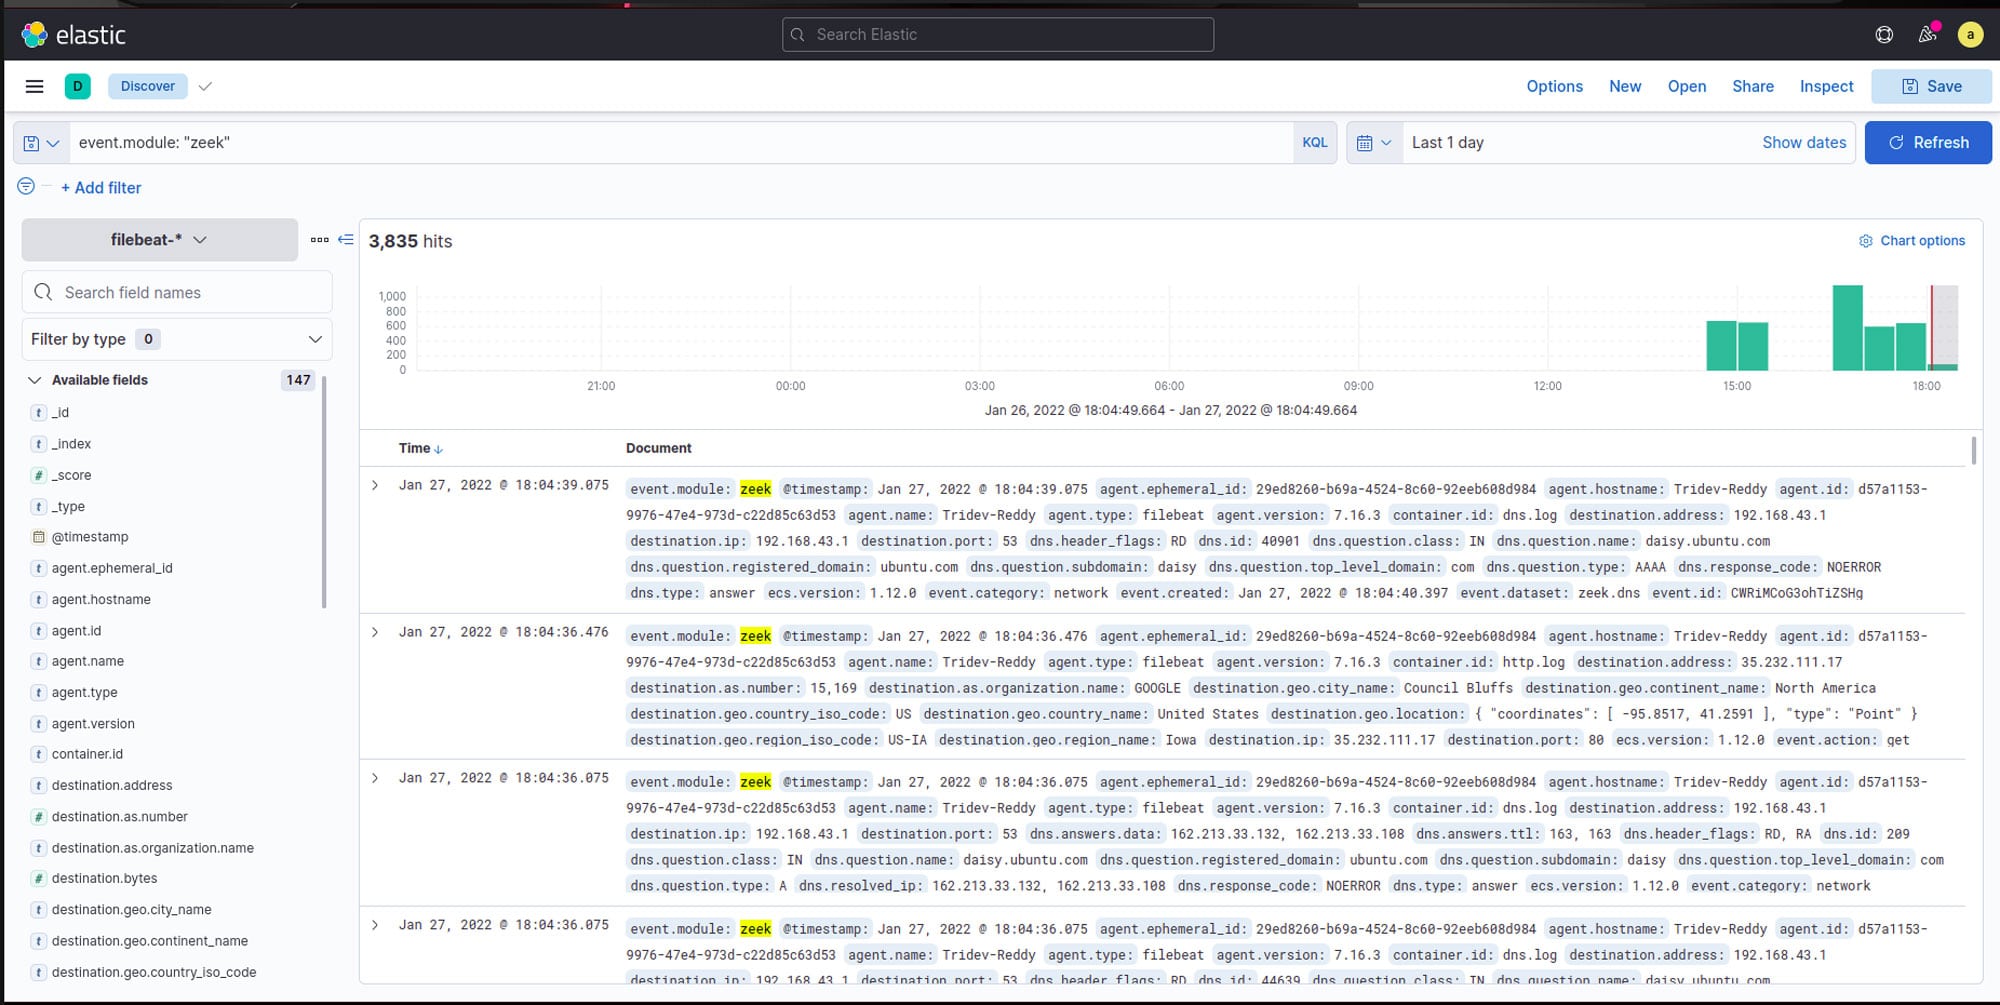
Now let’s move to the Discover tab and check the results by filtering using the query:
event.module: “zeek”
This query will filter all the data it received in a certain time and show us only the data from the module named Zeek (Figure 7).
Acknowledgements
The authors are grateful to Sibi Chakkaravarthy Sethuraman, Sudhakar Ilango, Nandha Kumar R. and Anupama Namburu at the School of Computer Science and Engineering, VIT-AP for their continuous guidance and support. A special thanks to the Center for Excellence in Artificial Intelligence and Robotics (AIR).


