We often need to search and analyse the logs of our Windows based computer or server to get an insight into the system or application. Such analysis gets easier if the logs are sent to Elasticsearch. This article is a step-by-step guide on how to integrate Winlogbeat and Sysmon with Elasticsearch.
Winlogbeat is a tool that runs as a service on a MS Windows based computer and is capable of sending Windows logs to Elasticsearch for analysis. It’s an open source and free tool to keep a tab on what’s happening in your Windows based system. It streams Windows event logs to Elasticsearch and Logstash.
Installation of Winlogbeat
For installing Winlogbeat on a Windows computer, follow the steps given below.
Step 1: Go to the download link and download the Winlogbeat zip file by selecting your system architecture. The link is https://www.elastic.co/downloads/beats/winlogbeat/.
Step 2: Once the download process is done, extract the contents in the zip file to C:\Program Files\. Rename the folder as Winlogbeat for later use.
Step 3: Now open PowerShell as Administrator and navigate to the directory C:\Program Files\winlogbeat\.
Step 4: Enter the following command in PowerShell:
.\install-service-winlogbeat.ps1
The output of the above command should look like what’s shown in Figure 1.

If you get an error like ‘Script execution is disabled’, then run the following command:
PowerShell.exe -ExecutionPolicy UnRestricted -File .\install-service-winlogbeat.ps1
Configuring Winlogbeat
Once the installation process is completed, we need to configure the config file (.yml file) to send the captured logs from Windows to Elasticsearch. Open the configuration file, winlogbeat.yml, which is present in the directory where the zip file is extracted.
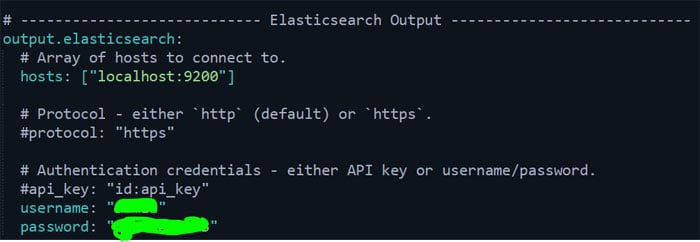
In that file, scroll down to the output elasticsearch section and uncomment that part (output.elasticsearch, hosts, user name and password).
Make sure your host is set to what you configured while configuring Elasticsearch. By default, it is localhost:9200. Enter the user name and password of the ‘elastic’ user, which you might have generated after installing Elasticsearch.
After configuring, the output should look similar to what is shown in Figure 2.
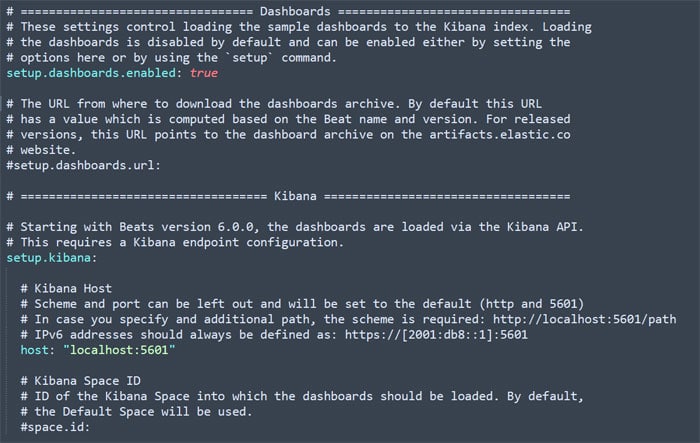
Now we need to configure the setup.kibana part in the same file. Uncomment that part, and make sure the host is set properly to the one you configured while installing Kibana. For getting all the logs in a neat visualised format, make sure setup.dashboards.enabled is set to true in the same file. Refer to Figure 3.
Next, we will modify the winlogbeat.event_logs section in the same file. We need to mention which services are to be monitored. By default, it has three services — application, security and system. You can leave it as default or you can add any if needed according to your use case.
Once everything is done, run the command given below in PowerShell (same directory) to save the configurations:
.\winlogbeat.exe test config -c .\winlogbeat.yml -e
Once you have successfully executed the command to save, load the assets for data visualisation, and run the command:
.\winlogbeat.exe setup -e
This completes the setup part. It’s time to start the winlogbeat. Use the following command to start Winlogbeat (in the same directory in PowerShell):
Start-Service winlogbeat
To check whether the service is running or not, start searching for services. This will prompt a window; scroll down till you find Winlogbeat. Make sure it is running. If the above configuration is done properly, then the service should be running (refer to Figure 4).
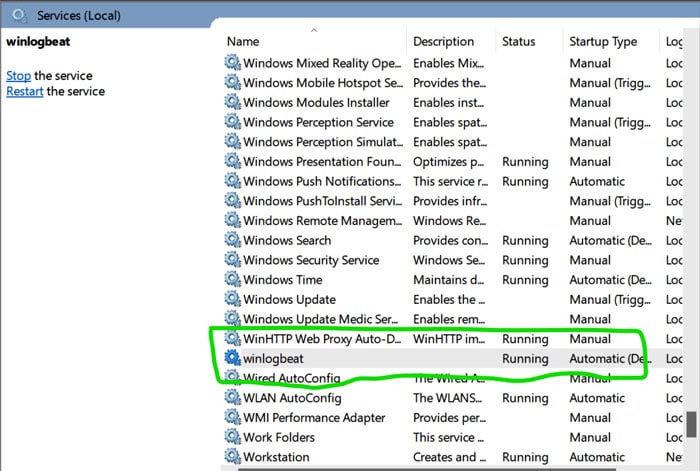
| Note: The Winlogbeat service will start running only if Elasticsearch and Kibana are running. |
Login to your Kibana dashboard, and in the Dashboard tab, select Winlogbeat. Once the dashboard is loaded, you can see all the windows events and logs in a visualised format (refer to Figure 5).
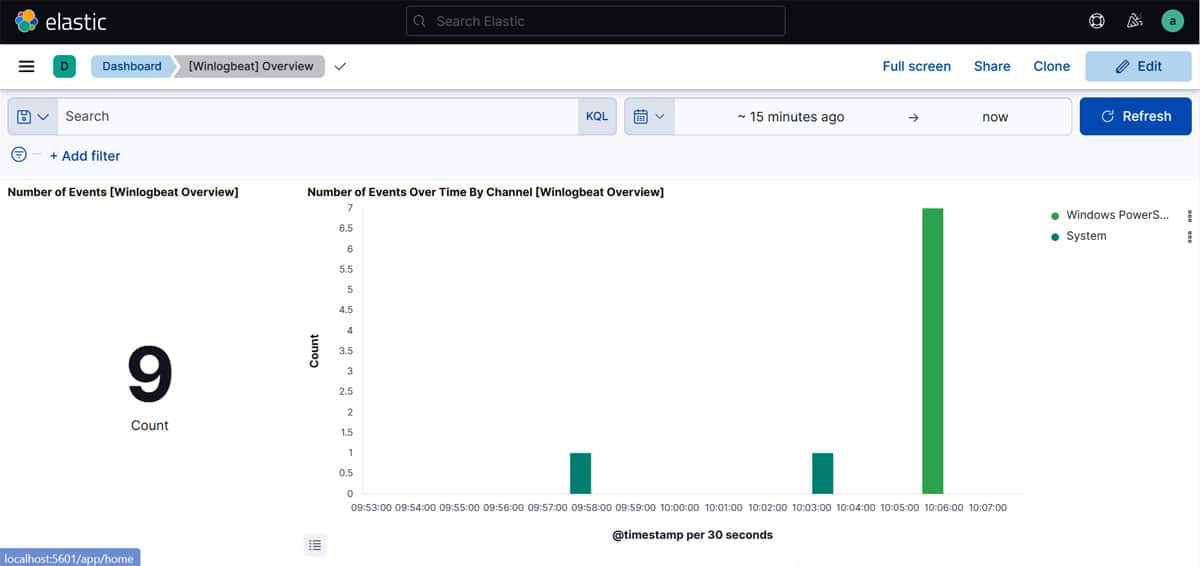
This completes our integration of Windows logs with Elasticsearch. Next, we will see how to configure Sysmon.
Sysmon
System Monitor (Sysmon) is a Windows service. Once installed and configured it remains persistent, and logs system activity to the Windows event log. This module provides very detailed information about process creation, network connections and any file changes.
Installation of Sysmon
For complete setup of Sysmon, two things must be installed. One is a Sysmon tool available in the zip file and the other is the configuration file from GitHub. The download links are given below:
https://docs.microsoft.com/en-us/sysinternals/downloads/Sysmon
https://github.com/SwiftOnSecurity/Sysmon-config
Create a new folder in C:/Program Files/. Extract both the files in that folder. Now open PowerShell as administrator and navigate to that directory. Run the following command:
.\sysmon64.exe -accepteula -i sysmonconfig-export.xml
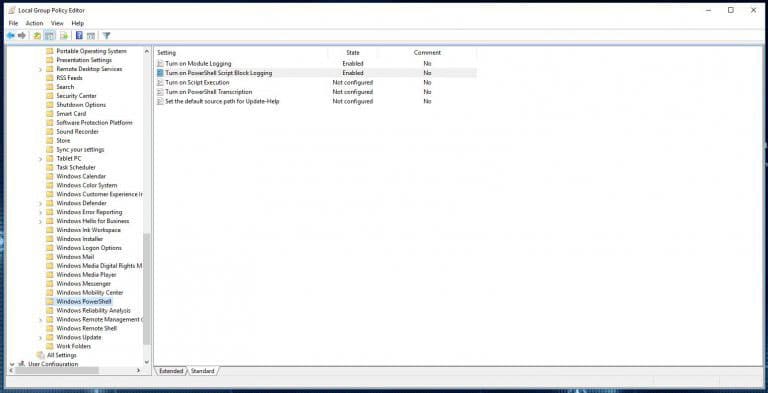
Open Local Group Policy (search in Start), and navigate to Computer Configuration > Policies > Administrative Templates > Windows Components > Windows PowerShell.
On the right side, enable ‘Turn on Module Logging’ and ‘Turn on PowerShell Script Block Logging’ (refer to Figure 6).
Now we need to update Winlogbeat so that it ships the logs from Sysmon too. For that, once again open the winlogbeat.yml file. Under the winlogbeat.event_logs section, make sure the following are added:
- Microsoft-Windows-PowerShell/Operational
- Microsoft-Windows-Sysmon/Operational
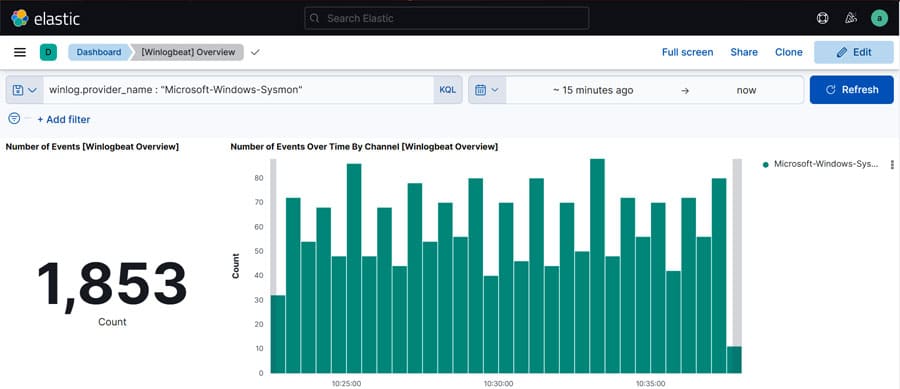
Once this is done, let’s check whether the logs are being sent to Kibana by Winlogbeat or not. Enter the following search query to check:
winlog.provider_name : “Microsoft-Windows-Sysmon”
The result of this query gives the details of logs sent by Sysmon (refer to Figure 7). If you didn’t find any logs, try to increase the time period or generate some traffic.
This is how we can install and configure Winlogbeat and Sysmon to stream logs to Elasticsearch and visualise the data. Depending on your use cases, you can add the name of the event logs to be sent in winlogbeat.yml file and cutomise the logs visualisation as per your requirement.


