


Mermaid helps to build diagrams and charts easily and effectively using simple, text-based codes. These diagrams can also be modified effortlessly later, as the source is integrated with them. We take a look at the features of this award winning tool and the various types of diagrams that can be built with it.
Building diagrams and charts has become an integral part of the day to day routine for most software developers. There are various tools available for this purpose. One challenge with diagrams is the decoupling of the source from the final output. So when you try to modify the diagrams later, it becomes difficult to trace the source. Mermaid provides an elegant solution to this challenge.
Mermaid is an open source tool for building diagrams, and bagged the Mermaid won “The Most Exciting use of Technology award” at the JS Open Source Awards 2019.
(https://osawards.com/javascript/2019). It is based on the Markdown language, and has been built by a team led by Knut Sveidqvist.
If you have simple knowhow of Markdown it is very easy to build diagrams and charts using Mermaid. There is no complicated learning curve to get familiar with the Mermaid syntax.
Even complex diagrams can be built with Mermaid’s syntax easily.
There are many exciting advantages of using Mermaid to build diagrams, as illustrated in Figure 1.
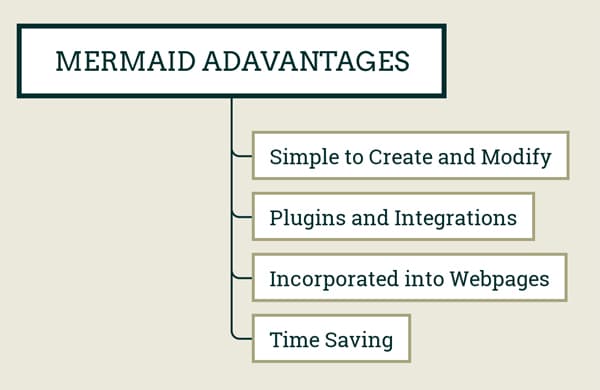
- The process of creating, editing and displaying diagrams with Mermaid is super simple.
- Mermaid has many plugins and integrations that make these tools co-work with your existing environment.
- These diagrams can be incorporated into web pages using a simple mechanism.
- It saves a lot of time for developers.
Getting started
The easiest way to get started with Mermaid is to use the Mermaid Live Editor. This web-based application can be accessed from https://mermaid.live/.
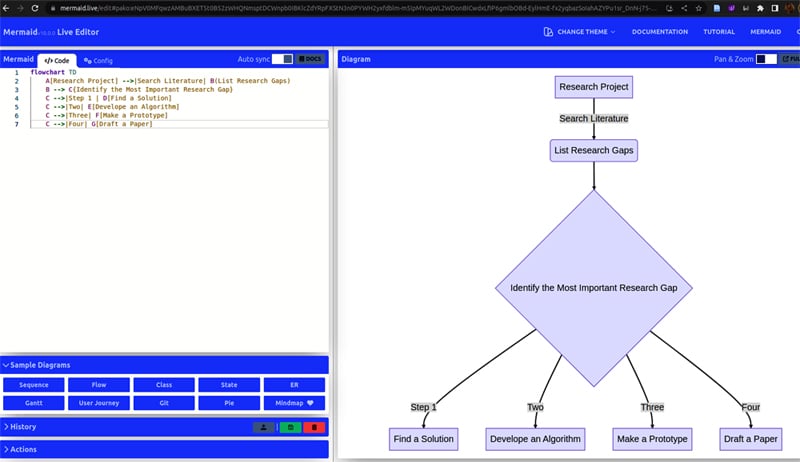
The Mermaid Live Editor is intuitive to use. In the left side panel you have the code editor and the right side panel has the output rendering of the code. There are options to select various types of diagrams from the editor. There are sample diagrams for each category in the Live Editor. You can use it as a start and go on to customise your diagrams.
From the Actions tab you can do the following:
- Copy the image to the clipboard.
- Download the diagram in various file formats such as PNG, SVG. The image size can also be adjusted using width and height parameters. The default ‘Auto’ size works well for most of the diagrams.
Instead of using Mermaid Live Editor, if you want to deploy Mermaid you can do the following:
NPM : npm i mermaid
Yarn: yarn add mermaid
Pnpm: pnpm add mermaid
Mermaid API
Without a bundler, you can use a <script> tag and an external address location. The mermaid.initialize can be called.
<script type=”module”> import mermaid from ‘https://cdn.jsdelivr.net/npm/mermaid@10/dist/mermaid.esm.min.mjs’; mermaid.initialize({ startOnLoad: true }); </script>
The parser will interpret whichever <div> or <pre> tags are given class=”mermaid”. The SVG versions of the charts will be rendered.
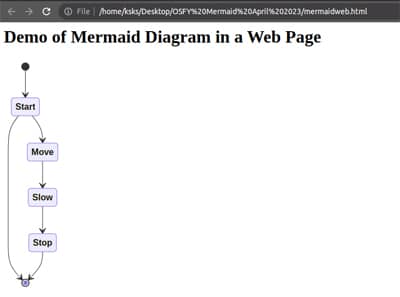
Using this, Mermaid diagrams can be easily inserted and rendered into web pages. A sample is shown below.
<html>
<head>
<script type=”module”>
import mermaid from ‘ https://cdn.jsdelivr.net/npm/mermaid@10/dist/mermaid.esm.min.mjs’;
mermaid.initialize({ startOnLoad: true });
</script>
</head>

<body>
<h1> Demo of Mermaid Diagram in a Web Page <h1>
<div class=”mermaid”>
stateDiagram-v2
[*] --> Start
Start --> [*]
Start --> Move
Move --> Slow
Slow --> Stop
Stop --> [*]
</div>
</body>
</html>
The outcome of this is shown in Figure 3.
Types of diagrams in Mermaid
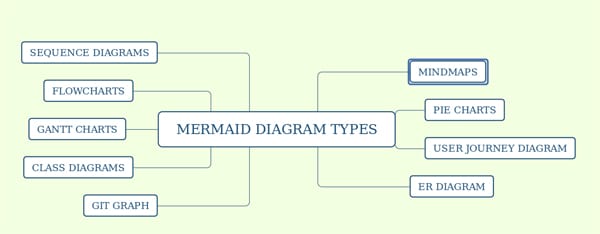
Mermaid enables us to build various types of diagrams.
- Flowcharts
- Sequence diagrams
- Gantt chart
- Class diagram
- Git graph
- ER diagram
- User journey diagram
- Pie
- Mindmap
The process of creating any type of diagram is the same. Once you get familiar with the Mermaid Markdown syntax, any type of diagram can be created simply.
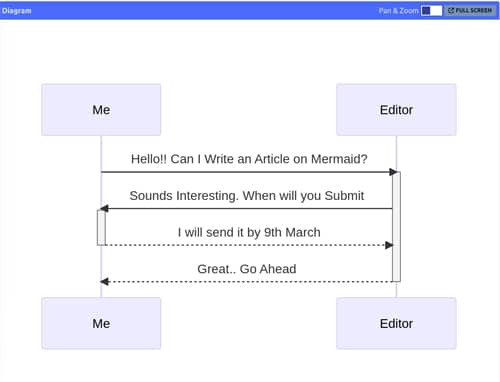
Sequence diagram: The code for creating a simple sequence diagram is as follows:
sequenceDiagram
Me->>+Editor: Hello!! Can I Write an Article on Mermaid?
Editor->>+Me: Sounds Interesting. When will you Submit
Me-->>-Editor: I will send it by 9th March
Editor-->>-Me: Great.. Go Ahead
The sequence diagram built with this code is shown in Figure 5.
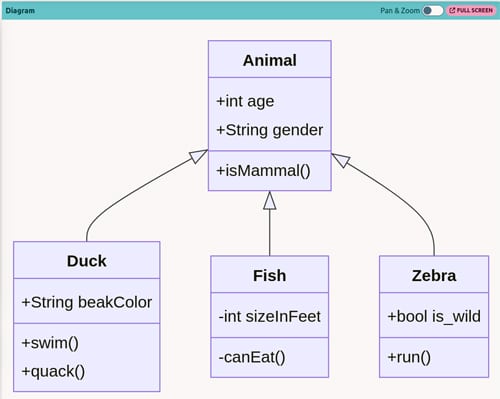
Class diagram: Class diagrams are very useful when you are building an object-oriented solution. The source of a sample class diagram is shown below.
classDiagram
Animal <|-- Duck
Animal <|-- Fish
Animal <|-- Zebra
Animal : +int age
Animal : +String gender
Animal: +isMammal()
class Duck{
+String beakColor
+swim()
+quack()
}
class Fish{
-int sizeInFeet
-canEat()
}
class Zebra{
+bool is_wild
+run()
}
The output class diagram is shown in Figure 6.
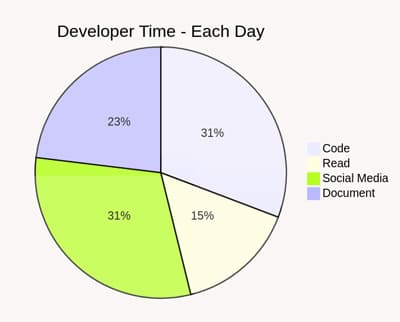
Pie chart: Pie charts can be built with Mermaid as follows:
pie title Developer Time - Each Day
“Code” : 200
“Read” : 100
“Social Media” : 200
“Document” : 150
The output of this code is shown in Figure 7.
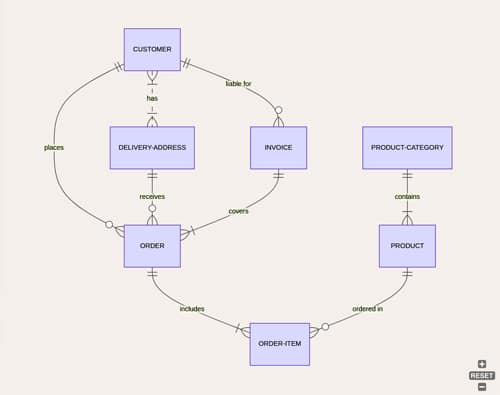
ER diagram: Entity relationship (ER) diagrams can also be built using Mermaid. A sample ER diagram is shown in Figure 8. The source for the diagram is as follows:
erDiagram
CUSTOMER }|..|{ DELIVERY-ADDRESS : has
CUSTOMER ||--o{ ORDER : places
CUSTOMER ||--o{ INVOICE : “liable for”
DELIVERY-ADDRESS ||--o{ ORDER : receives
INVOICE ||--|{ ORDER : covers
ORDER ||--|{ ORDER-ITEM : includes
PRODUCT-CATEGORY ||--|{ PRODUCT : contains
PRODUCT ||--o{ ORDER-ITEM : “ordered in”
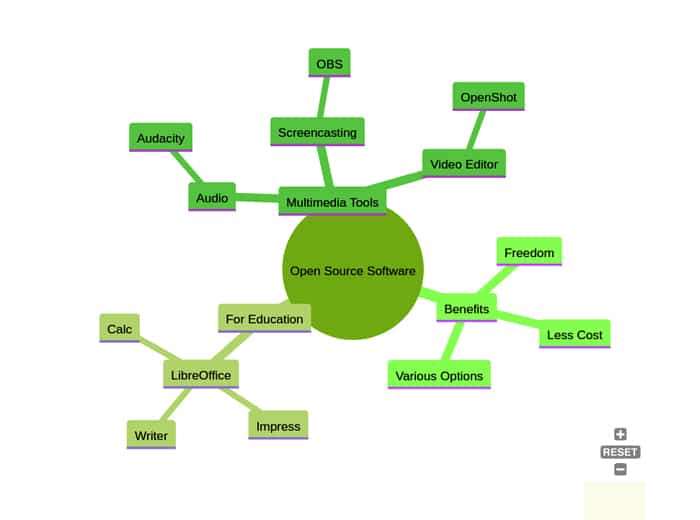
Mindmap: Mindmaps are very effective tools for brainstorming. Mermaid allows you to create mindmaps.
mindmap
root((Open Source Software))
Benefits
Freedom
Less Cost
Various Options
For Education
LibreOffice
Impress
Writer
Calc
Multimedia Tools
Audio
Audacity
Screencasting
OBS
Video Editor
OpenShot
Themes for the diagrams
Mermaid diagrams can be rendered in various themes. The following themes are supported by it.
- Default: If no theme information is provided, then the diagrams are rendered in this theme.
- Neutral: This theme is optimised for black-and-white printing.
- Dark: This is for creating Mermaid diagrams in dark mode.
- Forest: This theme will create diagrams in green mode (the mindmap shown in Figure 9 is built with the forest theme).
- Base: This is used for customisation.
Accessibility
Accessible diagrams are of great use for people who are using assistive technologies. With the prolific growth of web applications, the ARIA (accessible rich internet applications) standards are provided by W3C. The sample ARIA information incorporated in diagrams is shown below:
<svg
aria-labelledby=”chart-title-mermaid-1668725057758”
aria-describedby=”chart-desc-mermaid-1668725057758”
xmlns=”http://www.w3.org/2000/svg”
width=”100%”
id=”mermaid-1668725057758”
>
<title id=”chart-title-mermaid-1668725057758”>This is the accessible title</title>
<desc id=”chart-desc-mermaid-1668725057758”>This is an accessible description</desc>
</svg>
Here is a sample accessible diagram that includes accTitle and accDescr (accessible title and accessible description).
graph LR
accTitle: Accessible Diagram
accDescr: A demo of building accessible diagrams with Mermaid
A[Decide the Chart type] --> B{Add ARIA}
B --> D[Accessible Components]
To sum up, Mermaid is a great open source option for creating a vast variety of diagrams using text based codes.


