Data generated by applications is increasing by leaps and bounds almost every moment. Organisations need cloud service providers to help them manage and store this data, as well as make it available whenever they need it. Data management in the cloud has evolved into a science, and Google, Microsoft and Amazon have good solutions on offer.
Data is a collection of representation of facts as text (news), numbers (figures), graphics (datasheet), images, sound or video. Information is data in context. Without a context, data is absolutely meaningless or clueless to interpret; we create meaningful information by interpreting the context around data collected from different sources. The resulting information helps to take decisions. So, data architecture (DA) is an integral component for defining the information architecture (IA); it is concerned with the design and intent to use data in a given structured format (like databases or data sources and file systems). A data architect models the data in stages (conceptual, logical and physical), and must relate the data to each process that consumes (uses) it.
IA is the starting point for data modelling, design, and development to support business process needs. Any new models or changes to existing models must be consistent with the definitions of existing information objects. IA imposes coherence and consistency in both the definition and use of common data objects. Data management involves data architecture, information architecture, data management and governance, data security and data life cycle management.
Modern data analytics and management require high resources like CPU, memory and storage, and it is a costly investment to handle this on-premises. A cloud platform easily enables agility, scalability, reliability, availability and security for data management solutions.
Data analytics in the sports industry
We know that technology plays a vital role in modern sports in multiple ways like training, planning the game strategy, improving user experience, automating complex and humanly inefficient activities (e.g., fourth umpire reviews in cricket) and, above all, generating historical data for future analysis and training.
Today, the sports industry is using data analytics in various ways.
Dynamic modelling handles changing conditions and prepares focused data models for quicker action including match analysis, player analysis, venue analysis and forecasting. This kind of dynamic modelling helps to build robust and reliable data services quickly.
Data cleaning and preprocessing helps to use the right set of data for analytics, data science and predictive analysis. It enables cleaning up of unwanted data and eventually helps in accelerating data analysis due to the use of focused data sets.
Data management analyses historical data and predicts future trends using predictive analysis by managing data science and machine learning models.
In many sports events, Big Data analytics is used for predictive and historical data analysis using data science, IoT is used for data collection and transfer from the entire field area, cloud computing is used to prepare scalable and agile architecture; AI and ML are used for statistical analysis, model training and anomaly behaviour detection (e.g., pose analysis, field condition analysis, player performance analysis); and drones are used to capture and collect data for data analytics.
In short, the use of technology in sports events enhances the user experience, reduces manual errors, and records various activities for training and analytics purposes.
Time series database solutions
When you plan for data analytics or metrics monitoring, you need data that is bound to time series. As an example, time bound data is used to analyse server performance during a given period of time, or understand the market reach of a product for a given period of time to forecast future trends. Time bound data analysis helps to prepare real-time inferences based on facts.
Traditionally, time series data was handled by relational database management systems (RDBMS) but these were not found to be efficient for real-time analytics and statistical evaluation. The use of time series databases (TSDB) started in 2011, beginning with OpenTSDB, and got more popular with Facebook’s Gorilla (in-memory data store) solution. Now time series databases are more popular for time series event analysis and data analytics.
Time series databases store data in a sequence of time intervals to track data changes over time. These purpose-built solutions have three features to handle time series data:
- Time stamp based recording of data in the database
- Time stamps are associated with time zones and calendars automatically
- Sampling frequency such as periodic time sampling and discrete sampling
In cloud platforms, time series data storage is more popularly used for observability, IoT enabled services and event analysis functionality. For example, Microsoft has introduced its time series database as Amazon Timestream in 2018. Microsoft has introduced time series data visualisation with Azure Data Explorer, analytics using Azure time series insights (TSI) and time series metrics analytics with Google BigTable. Prometheus is the most popular third-party monitoring and management service across all cloud platforms — it is efficient in time series data visualisation and analysis.
OpenTSDB, InFluxDB and Apache Druid are also popular time series database services popularly used for events, trend analysis, market trends, stock market changes, application performance monitoring and infrastructure KPI analysis.
Time series databases are popular for banking and financial data analysis, IoT data collection and monitoring, stock and share trading, retail market trend analysis, market basket analysis, and health care trend analysis.
Microsoft Purview: Data management solution on the Azure platform
In 2021, Microsoft launched Azure Purview, now known as Microsoft Purview. This cloud native data governance solution helps organisations manage cloud and data on-premises.
Tons of features are packed into Microsoft Purview (Figure 1):
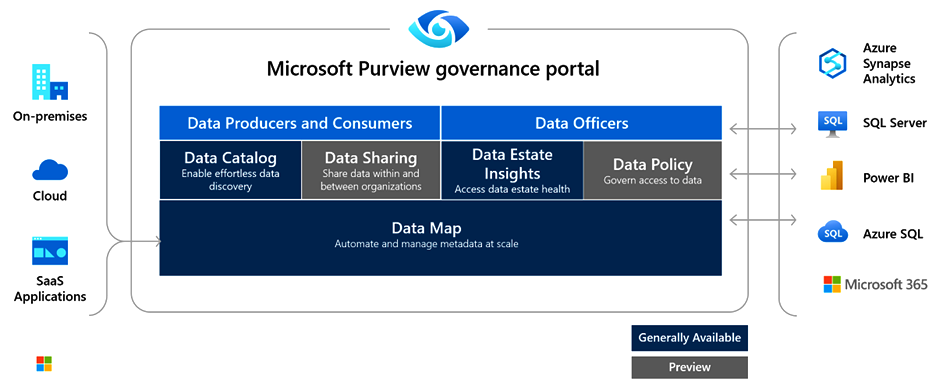
- Data discovery to create a unified map of data assets and their relationships
- Data discovery to help businesses do smart search
- Strong visibility into sensitive data across the entire data bank
- Strong central management of data
The architecture of Microsoft Purview is composed of:
- Data map
- Data catalogue
- Data estate insights
- Data sharing
AWS Clean Rooms: Data management solution on the AWS platform
With Amazon’s AWS Clean Rooms (Figure 2), we can collaborate with multiple partners and clients to prepare data analytics, reports and insights. This can be achieved by sharing data with protection, thus maintaining data privacy for all the concerned parties.
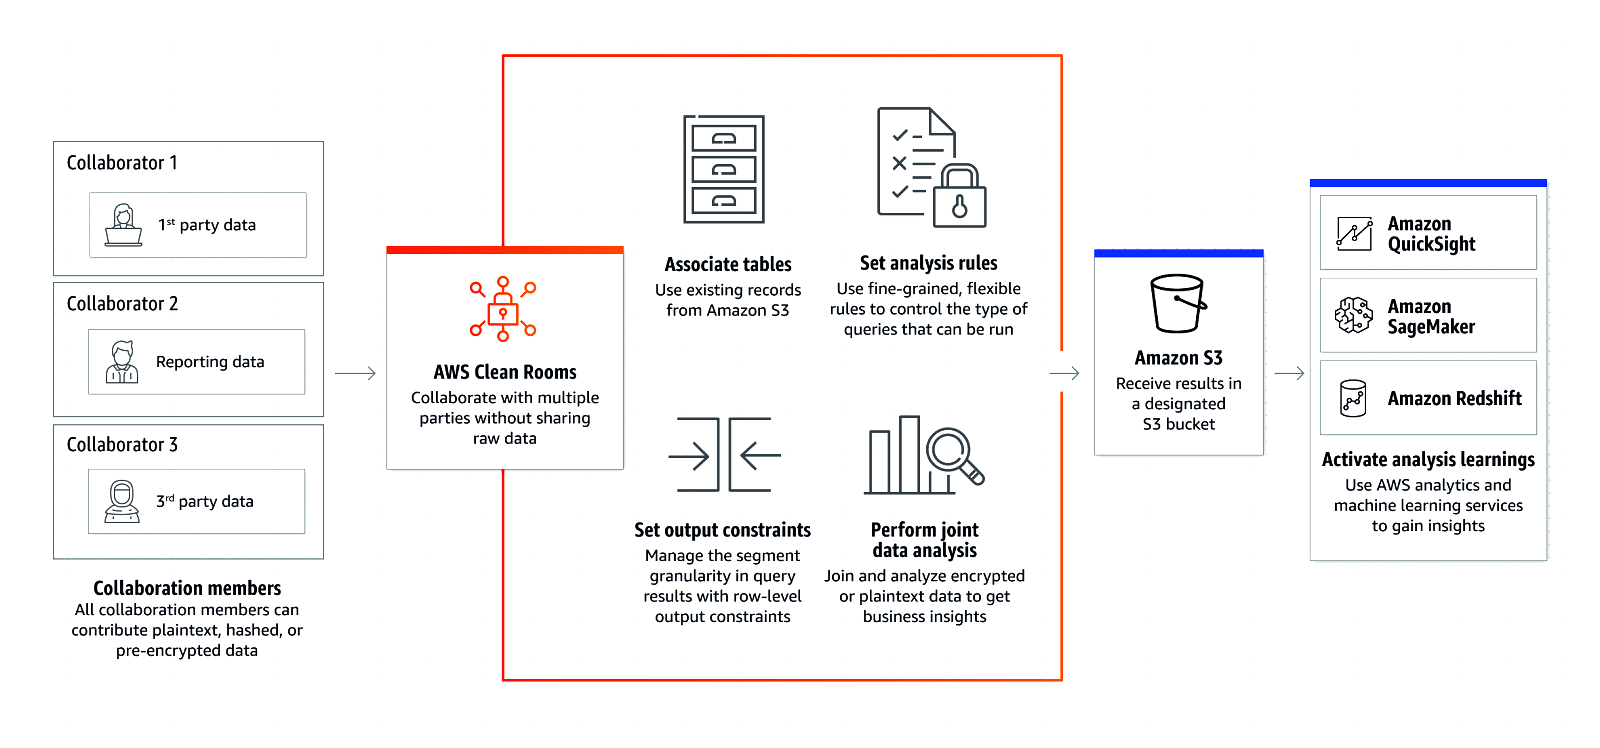
We can use AWS Clean Rooms to share data with partners or vice-versa as plain text, hashed data dump on S3 bucket, or pre-encrypted data. It can be configured easily for multiple collaborators without revealing raw data of the partner organisation. We can perform joint analysis with AWS Clean Rooms for research or market analysis, or improved reporting.
This kind of service helps to play around with real customer data for data analytics in a sandbox setup, before the actual live data is experienced in public for data analysis. This helps to improve reporting and monitoring, as well as product development.
We can use templated queries for controlling data operations, flexible rules to handle data and its access management, and associate existing data (e.g., historical data analytics) for collaborative data analytics. We can use AWS machine learning services like SageMaker and Quicksight for deep dive analytics and insights from multiple collaborative data using AWS Clean Rooms.
Data shared by partners and clients in AWS Clean Rooms is fully secure and protected from unauthorised access. It is encrypted, safe to store, and safe to clean and remove from AWS Clean Rooms. It supports file formats like csv and parquet, and can be pre-encrypted before being transported for data analytics.
Since it has been released only recently, it is available only in selected regions; we can expect general availability (GA) of AWS Clean Rooms soon.
Visual data exploration in Amazon Neptune
Graph databases are popular for both transactional data (OLTP) and analytical data (OLAP) visualisation, for a quick analysis of entity relations and data dependencies. Amazon Neptune (Figure 3) is a popular, fully-managed graph database that is fast and reliable for interpreting data visually. It helps to visually interpret highly connected data sets, prepare knowledge graphs and navigate data easily.
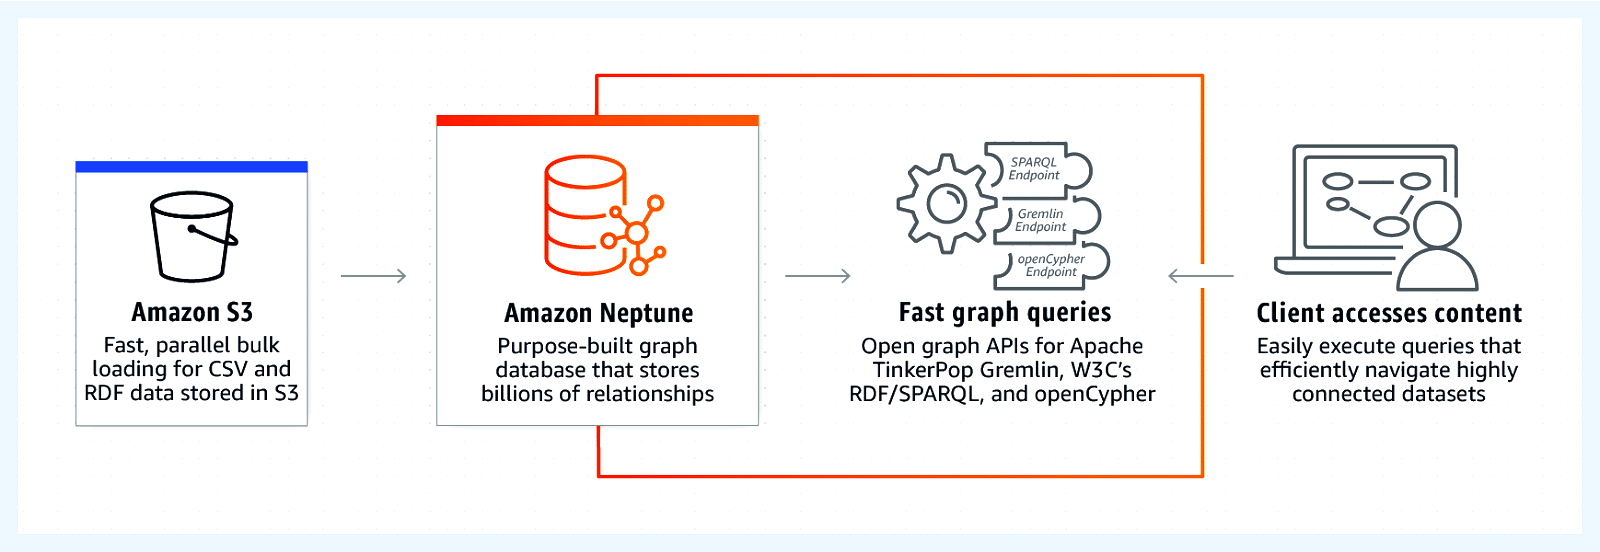
Amazon Neptune is a low-latency graph database with multi-regional and multi-availability zone replication, continuous backup to Amazon S3 bucket for file streaming and data feeds, and point-in-time recovery and read replicas for high throughput with queries. It uses the Apache TinkerPop framework for graph visualisation of data set and graph analytic capabilities, and uses Apache TinkerPop Gremlin as a graph traversal language to express complex traversals visually.
Amazon Neptune supports querying through W3C’s SPARQL and Neo4j openCypher to navigate through connected data sets with the support of Apache TinkerPop Gremlin. It also supports Open Graph API with Gremlin and SPARQL for fully-managed graphical data sets.
Recently, Amazon Neptune announced native integration and support for open source Graph Explorer for visually interpreting data sets through a web application interface based on ReactJS. It can be deployed as a Dockerized image in Amazon EC2 or Amazon ECS, and supports SPARQL and Apache TinkerPop Gremlin.
We can prepare data sets in Amazon Neptune through queries and use ‘send to explorer’ to connect to the Data Explorer source from Graph Explorer, in order to visually interpret the data sets and navigate the collection easily without querying data every time.
Graph Explorer reduces the work involved in querying and data set preparation, and is useful for non-technical users to query and interpret data visually through a drag-and-drop web UI interface. This can help in fraud detection, data grouping and data mapping use cases with Big Data applications.
Google Dataplex: Data management solution on the GCP platform
Google Dataplex (Figure 4) helps organisations centrally administer, discover, and monitor data across diverse data lakes and warehouses, and perform powerful data analytics.
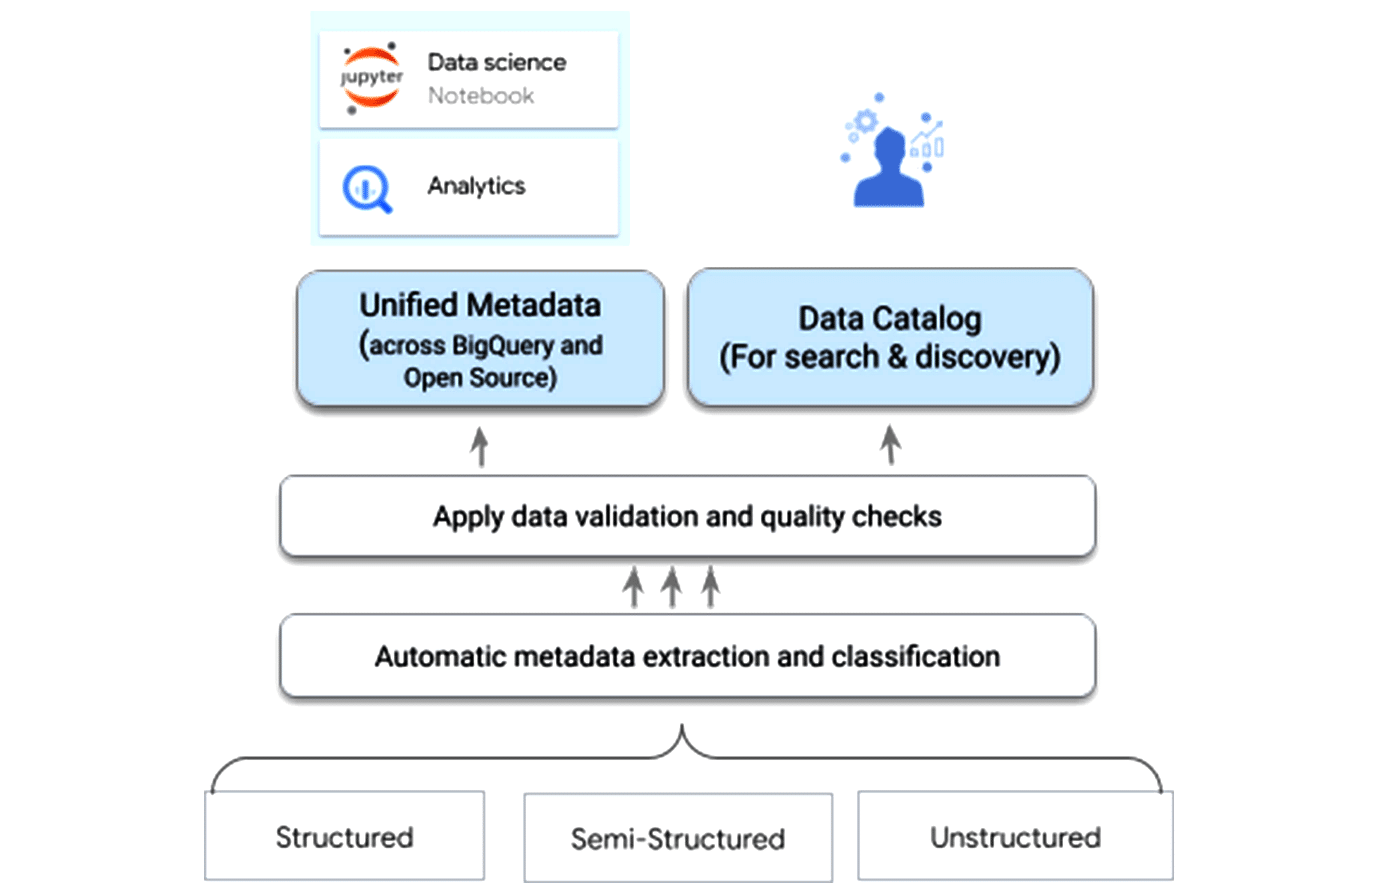
The following are the key features of Dataplex.
Data discovery: It facilitates automated data discovery, classification and enrichment of structured, semi-structured and unstructured data in Google Cloud with powerful intelligence.
Data organisation: It supports organisation of data spanning multiple storage locations like dataplex lakes and zones.
Security: Supports powerful data enforcement policies, management and monitoring of data for classification and authorisation.
Serverless data exploration: Supports interactive query generation with one-click access to SPARK-SQL queries and Jupyter Notebooks, enabling powerful collaboration between users.
Advantages of cloud data management
Cloud data management has a range of benefits.
Pay as you go: All cloud providers offer subscribers the benefit of paying on a per gigabyte per month basis. This helps organisations to cut excessive storage costs.
Scalability: Cloud providers provide strong and scalable solutions to subscribers. If an organisation runs short of storage at any time during the day or night, cloud providers automatically scale the storage and make sure that organisations never run out of capacity.
Flexible access: With cloud data management, subscribers can access their data anywhere and anytime.
Security: Cloud providers provide an extra layer of security to keep the organisations’ data safe and private. They honour all the security policies of the organisation.
Backup automation: Almost every cloud provider is rolling out services to automate the backup of crucial data at regular time intervals.
AI-driven enhanced intelligence: Modern cloud data management providers provide AI capabilities to ensure automatic discovery and cataloguing of data across various systems like ERP, CRM, etc.
Cloud data management spans the end-to-end life cycle of data. Proper management minimises the risks and costs of security breaches. It also ensures that clients get accurate data when and where it is needed.


