Most projects and companies maintain a lot of data in the form of Excel files. These are usually reports, and data needs to be generated from these Excel files in a periodic manner, like a status update. Sometimes, when a specific event takes place, there may be some follow-up action required like generating a mail or filing an escalation in case the data indicates something of interest has happened. So lets look at how such Excel files can be interfaced by using Python.
The problem of work summaries
Let us a look at a specific problem in this regard. Assume that employees in a particular team are working across different projects for different customers. Figure 1 gives an idea about the association between an employee, a project and a customer.
An employee could be working on one or more projects. A project could also have one or more employees. A project is targeted to be delivered to only one customer (in our example) though a customer may be involved with multiple projects.
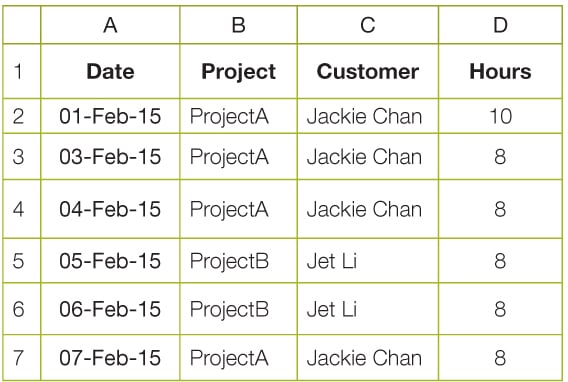
To track the effort being spent on these projects, employees could be asked to record their work in the following manner under the heads shown below.
Let us assume all employees are filing such reports in one Excel file each, in a common location. So how do we arrive at the overall summary of efforts put in by the team on a particular customer, over a period of time?
One of the ways in which this could be managed is to do some fancy linking inside a master Excel file. Then write some Excel macros to walk through each file to summarise the data. As can be imagined, this is tedious, involves manual and automated steps, and can be error prone. Also, summaries over different time periods will have to be managed through macros or filters based on pivot tables inside a master Excel file. Instead, let us look at a different way of doing the same task, using Python and Excel interfacing libraries.


Introducing the Python-Excel interfacing library
Let me introduce the xlrd package for Python available from the Python Foundation at https://pypi.python.org/pypi/xlrd
The package used to write into Excel files is available as xlwt. As a collective package, xlutils comprises both xlrd and xlwt. In this column, we use only xlrd.
xlrd is a library that can be used to work with Microsoft Excel spreadsheets (.xls and .xlsx) on any platform. Let us check the interfaces available in the following sections and look at how to use them.
Installation of the package
The installation instructions in the readme.html file are pretty clear. On any OS, unzip the .zip file into a suitable directory, chdir to that directory, and type in python setup.py install.
If the installation is successful, you should be able to do whats shown below at the IDLE GUI prompt:
>>> import xlrd
>>>
Important interfaces of the xlrd package
xlrd provides the following interfaces for reading the Excel values.
- xlrd::open_workbook(path_to_Excel_file): This method returns an object of the Book class, with which we will work quite a bit to get access to the Excel data.
- Book::sheet_by_index(sheetx): This returns an object of the Sheet class, with which we will access the individual cells of a sheet.
- Sheet::cell(row,col): This returns a Cell object for the particular row and column values.
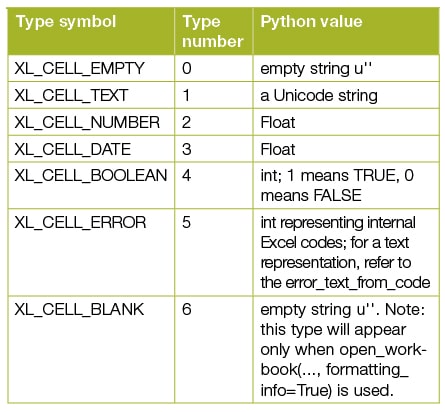
- A Cell object should always be retrieved from other methods described above from the Book and Sheet objects and not invoked directly. Critical for a Cell object is the value attribute, the type of which varies according to the data type of the cell represented by another int attribute which is ctype. The following table gives the type that value has, which depends upon the type of the cell.
 Note: In this column, we will work mostly with text and date types only.
Working with dates
As quoted in the xlrd tutorial, in Excel, dates have many problems.
- Dates are not stored as a separate data type but as floating point numbers, and you have to rely on (a) the number format applied to them in Excel and/or (b) knowing which cells are supposed to have dates in them.
- Dates are stored as elapsed days from epoch, which differs between Windows and Mac versions of Excel.
- The Excel implementation of the default Windows 1900 based date system works on the incorrect premise that 1900 was a leap year.
Sample usage
Let us now put together a small spreadsheet with the data as shown in Figure 2.
We can open this using the interfaces of xlrd in the IDLE GUI.
>>> testbook=xlrd.open_workbook(C:\\test.xlsx) >>> testbook <xlrd.book.Book object at 0x0000000002F760B8>
Note: To qualify a file name via the open_workbook API in Windows, I had to escape the \ backslash in the path with another, to indicate that I am not using any special sequence.
Once a book is available, we can open a sheet of the same.
>>> testsheet=testbook.sheet_by_index (0)
>>> testsheet
<xlrd.sheet.Sheet object at oxooooooooo2F73A90>
From the sheet, we print the following values. You can see the values and types associated with the values.
>>> testsheet.cell (1,0) xldate:42036.0 >>> testsheet.cell (1,1) text:u ProjectA >>> testsheet.cell (1,2) text:u Jackie Chain >>> testsheet.cell (1,3) number:10.0
Note: Indexes of both rows and columns start with 0 (zero), which is good for us as we naturally escape the header row.
The date, as can be seen above, is stored as a number, which xlrd shows as an xldate type. Let us do some more processing with the same. To work with Python dates, we would need the date and datetime classes from the datetime module.
>>> from datetime import date, datetime
>>> date.today()
date.date(2015, 2, 1)
We can see that the date 1 Feb 2015 is represented in Python with the year, month and date components.
To work with the xldate type, let us import and use the xldate_as_tuple interface.
>>> from xlrd import xldate_as_tuple
>>> testdate=xldate_as_tuple (testsheet.
cell(1,0).value,testbook.datemode)
>>> testdate
(2015, 2, 1, 0, 0, 0)
We can see that the same date is stored as a datetime internally and has hours, minutes and seconds components too.
To extract only the date part and ignore the last three, we can do a sub-tuple selection and initialise the date with the same.
>>> testdate
(2015, 2, 1, 0, 0, 0)
>>> date (*testdate[:3])
datetime.date (2015, 2, 1)
Now, simple comparisons can be done between Python date classes in the following way.
>>> date.today()==date(*testdate[:3])
True
Note: In the above segment, we make a slice of testdate starting from 0 to 2 and <3, with only the first three values from testdate to get date components of the year, month and day. We use the * operator to unpack and list the values to be used to construct a date object.
Designing the program
So, having set those items up, let us come back to the original problem. We need to have a program that summarises the efforts by the customers name and prints it. Let us assume that the data now looks like whats shown in Figure 3 in a file c:\test.xlsx:
Given that all reports will be in a particular directory, we will need a way to get a list of the report files so that we can process them in our program. Python provides us with the glob object which helps to do that.
>>> import glob >>> glob.glob (C:\*.xlsx) [C:\\test.xlsx]
Heres the sequence for the program.
- Create a dictionary object to store nHours for each customer name.
- Using the glob object, fetch the list of xlsx report files.
- For each report file:
- Cycle through each row of sheet (0)
- For each row with a valid entry
- Check if the date is present and is valid
- Check if the date is present and the date is within the last seven days
Fetch the hours spent
Fetch the customers name
Customer hours + hours spent
4. Print the final output from the map
a. Print the customers name and the total hours spent on the customer
The following is the complete program:

summarize effort values from xlsx reports and print the same.
for each report file in a directory
read each line and update corresponding customer hours summary
when done, print the summary
# import glob object to read xlsx file names
import glob
# import xl reader module
import xlrd
#get date and datetime
from datetime import date,datetime,time
from xlrd import open_workbook,xldate_as_tuple
# note position of different data items in the summary file
DATECOL = 0
CUSTOMERCOL = 2
HOURSCOL = 3
# constant to store value to check for a weeks data
ONEWEEK = 7
ONLYDATE = 3
#customer constants used
CUSTA=Jackie Chan
CUSTB=Jet Li
#initialize customer hours map to zero
CustHours = {CUSTA: 0, CUSTB: 0}
for report in glob.glob(C:\*.xlsx):
print Processing :+report
book = xlrd.open_workbook(report)
sh=book.sheet_by_index(0)
for rx in range(1,sh.nrows):
# if date in current week then add value to corresponding section
if sh.cell(rx,DATECOL).value <> :
try:
date_value = xldate_as_tuple(sh.cell(rx,DATECOL).value,book.datemode)
except:
print error with date
continue
t = date.today() - date(*date_value[:3])
if t.days <=ONEWEEK and sh.cell(rx,HOURSCOL).value <>:
hoursspent = float(sh.cell(rx,HOURSCOL).value)
customer=str(sh.cell(rx,CUSTOMERCOL).value)
#summarize per customer also
#get project hours if already present
CustHours[customer]+=hoursspent
#print the summaries
print Summary per customer
print CUSTA+:+str(CustHours[CUSTA])+ hours
print CUSTB+:+str(CustHours[CUSTB])+ hours
Note 1: Note that we print the report being processed to help in debugging, in case any data makes the program misbehave.
Note 2: We process xldate_as_tuple in a try:, except: block so that we handle any exceptions thrown by incorrect dates. We print an error message in that case, which along with the report file name will help us know where the problem is.
When run through Python, the above program produces the following output:
Processing :C:\test.xlsx
Summary per customer
Jackie Chan:24.0 hours
Jet Li:16.0 hours
More ideas
Think about how you can improve the above solution. To start with, we could make all those constants configurable and pass them as input to our program through a cfg file (refer to Practical Python Programming in the February 2015 issue of OSFY for how to use a ConfigParser module).
We could use better formatting to output the summary (refer repr() and format() interfaces).
Also, readers familiar with pivot tables could start thinking about how to implement generating such pivots from Python.


