A network monitoring system is an essential constituent of any enterprise, small or large. A substantial amount of money is spent on establishing the entire network infrastructure, mainly servers and network components, expanding it as per changing needs and most important, keeping it alive all the time. With the network infrastructure constantly growing, it becomes a tedious job for network and systems administrators to continuously keep an eye on every device, all the time. Hence, theres a need for a network monitoring system that does this job for them.
A network monitoring system can show the live statuses of all the devices – whether they are up or down, the resources being consumed by them, services running on them, etc – in one place. Moreover, it notifies the administrators immediately in case of a malfunction by sending them emails, SMSs or even phone calls, so that admins are always aware of what has gone wrong and at which point in the network.
When it comes to selecting the best monitoring tool, there are many alternatives to choose from, but Nagios is one of the finest options. It is available in two versions Nagios Core, which is open source and free, and Nagios XI, which comes with some added features and capabilities, but needs to be purchased. However, both deal with monitoring critical servers and network devices, both provide indications of problematic situations, and both report the issues to the admins through mails and/or messages to help minimise downtime, reduce commercial losses and improve SLA.
This article is about installing and configuring Nagios Core on a Linux system. To demonstrate this, I have used the framework mentioned below:
Nagios server: 192.168.0.109
Operating system: Red Hat Enterprise Linux 6.5
Nagios client: 192.168.0.108
Operating system: Red Hat Enterprise Linux 6.5
Nagios Core version: 4.0.8
Nagios plugins version: 2.0.3
Nagios Core installation
Installing the necessary packages and their dependencies:The required packages mainly include Apache, PHP, C compilers, C libraries and development libraries. These packages can be installed using the Yum install as shown below:
$ yum install wget httpd php gcc glibc glibc-common gd gd-devel make net-snmp
In order to make sure that the service httpd starts after every system reboot, it should be added to the startup as follows:
$ chkconfig httpd on
$ service httpd start
Downloading the Nagios Core and Nagios plugins packages: After the installation of the required packages, its time to download Nagios Core and Nagios plugins, which are available in the form of tarballs, from the official website.
$ cd /root
$ wget http://prdownloads.sourceforge.net/sourceforge/nagios/nagios-4.0.8.tar.gz
$ wget http://nagios-plugins.org/download/nagios-plugins-2.0.3.tar.gz
Adding the nagios user and nagios group: In order to submit and process external commands from the graphical user interface, we need to create a group, say nagios, and add a user, say nagios, to that group.
$ groupadd nagios $ useradd g nagios nagios
Nagios Core installation: Having downloaded the Nagios Core tarball file from the source, we will have to extract it in order to proceed with the installation.
$ tar xvzf nagios-4.0.8.tar.gz
Change to the nagios-4.0.8 directory to begin the configuration part. After executing the configure script, we have to compile the source code and then install it.
$ cd nagios-4.0.8
$ ./configure --with-command-group=nagios
$ make all
$ make install
$ make install-init
$ make install-config
$ make install-commandmode
$ make install-webconf
Now, restart the httpd service for the changes to take effect.
$ service httpd restart
To make sure that the nagios service starts after every system reboot, we must add it to the startup services as follows:
$ chkconfig nagios on
Nagios plugins installation: In order to monitor remote hosts and the services running on them, we need to install Nagios plugins. For this, we need to change to the nagios-plugins-2.0.3 directory, run the configure script, make and install the binaries.
$ cd nagios-plugins-2.0.3
$ ./configure --with-nagios-user=nagios --with-nagios-group=nagios
$ make
$ make install

Nagios Web access: We are almost done with the installation part and to verify if it is correct, you can open your Web browser and enter http://<NAGIOS-SERVER-IP-ADDRESS>/nagios
You will find a dialogue box asking for your credentials in order to access the Nagios Web interface (Figure 1).
So far, weve not created any login to access the Nagios Web interface. Lets create it now.
$ htpasswd -c /usr/local/nagios/etc/htpasswd.users <USERNAME>
Youll be asked to enter the password and then confirm it before a login is created.
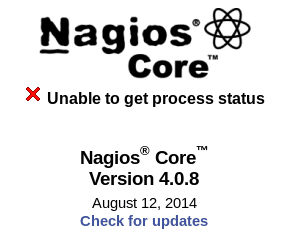
If you try logging in with the newly created credentials, you might encounter the following error displayed on the Nagios Core Web console: Unable to get process status (Figure 2).

This error is displayed as SELinux is enabled on the system. It can be verified as shown below:
$ getenforce
Enforcing
In order to disable SELinux, you can execute the following command, verify the status again and restart the Nagios service:
$ setenforce 0
$ getenforce
Permissive
$ service nagios restart
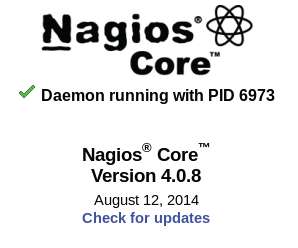
And the outcome is shown in Figure 3.

Again, you can verify the Nagios configuration file for its correctness using the following command:
/usr/local/nagios/bin/nagios -v /usr/local/
nagios/etc/nagios.cfg
Nagios Core configuration
We have now installed Nagios Core and we can access it from a Web console. On the left pane, a link named Hosts can be observed, which when clicked on displays the list of hosts currently being monitored (Figure 4).
Clearly, we have not added any hosts to Nagios, so it will just show localhost in the list of hosts being monitored.
The same can be observed in the Host Status Details shown in Figure 5. It gives us a brief How To of all the hosts configured to monitoring Nagios and their statuses the total number of hosts, the number of hosts that are up/down/unreachable, etc.


NRPE installation on a Nagios client: In order to monitor any Linux hosts using Nagios, we need to install the NRPE (Nagios Remote Plugin Executor) client on the host, so that the Nagios server can execute Nagios plugins remotely to fetch the host/service information.
To proceed with the NRPE installation, we need to download the NRPE tarball from the sources, as follows:
$ wget http://liquidtelecom.dl.sourceforge.net/project/nagios/nrpe-2.x/nrpe-2.15/nrpe-2.15.tar.gz
In the next step, we have to extract the tarball, compile the binaries and install them. Prior to that, make sure that xinetd is installed in the system; otherwise, install it manually using Yum.
$ yum install xinetd $ tar xvzf nrpe-2.15.tar.gz $ cd nrpe-2.15 $ ./configure $ make all $ make install-plugin $ make install-daemon $ make install-daemon-config $ make install-xinetd
In the next step, we need to open port 5666 for the NRPE service.
$ echo nrpe 5666/tcp # NRPE >> /etc/services
In the last step, we need to allow requests from the Nagios server. For this, edit the /etc/xinetd.d/nrpe file and mention the IP address of the Nagios server in front of only_from as follows:
only_from = 127.0.0.1, <NAGIOS-SERVER-IP-ADDRESS>
For the changes to take effect, restart the xinetd service as follows:
$ service xinetd restart
To verify the installation of NRPE on the Nagios client, execute the following command from the Nagios server:
$ /usr/local/nagios/libexec/check_nrpe H <REMOTE-HOST-IP-ADDRESS> NRPE v2.15
The output should display the NRPE version installed on the remote host, as shown above.
Adding hosts to Nagios monitoring: In order to add new servers to Nagios monitoring, lets create a directory with name servers inside the /usr/local/nagios/etc/objects directory. Configuration files for all the servers we add will reside in this directory.
$ mkdir /usr/local/nagios/etc/objects/servers
In order to add this directory in the configuration file, edit the /usr/local/nagios/etc/nagios.cfg file and uncomment the following line:
# cfg_dir=/usr/local/nagios/etc/servers
Now, change to the servers directory and create a new configuration file for our new Nagios client. Add the following details to the configuration file, for which you can take help from the templates.cfg file:
$ cd usr/local/nagios/etc/servers
$ vi MyLinuxServer.cfg
define host {
name MyLinuxServer
address 192.168.0.110
use generic-host
check_period 24x7
check_interval 5
retry_interval 1
max_check_attempts 5
check_command check-host-alive
notification_period workhours
notification_interval 60
contact nagiosadmin
register 1
}
Adding services for the hosts: To add any service to the hosts, one might need to create a command to monitor that service. This can be done by editing the /usr/local/nagios/etc/objects/commands.cfg file.
define command{
command_name check_nrpe
command_line $USER1$/check_nrpe -H $HOSTADDRESS$ -c $ARG1$
}
Similar to the hosts, we should create a directory called services in order to keep custom services configuration files. Again, the necessary changes should be made to the /usr/local/nagios/etc/nagios.cfg file.
$ mkdir /usr/local/nagios/etc/objects/services $ echo cfg_dir=/usr/local/nagios/etc/services >> /usr/local/nagios/etc/nagios.cfg
To add services for the host MyLinuxServer, lets create a configuration file MyLinuxServer.cfg in the services directory as shown below:
$ cd /usr/local/nagios/etc/objects/services
$ vi MyLinuxServer.cfg
define service {
use generic-service
host_name MyLinuxServer
service_description Server Uptime
check_command check_nrpe!check_uptime
notifications_enabled 1
}
Note: Whenever changes are made to the /usr/local/nagios/etc/nagios.cfg file, execute the following command to check for any errors in the configuration:
/usr/local/nagios/bin/nagios -v /usr/local/nagios/etc/nagios.cfg
After adding the host to the Nagios configuration, restart the Nagios service once on the Nagios server, and observe the changes in the Nagios Web console (Figure 6).
In a similar manner, many more hosts and services can be added to the Nagios configuration.

Creating custom Nagios plugins using the Bash script:
Even though the Nagios plugins that we have already installed offer a wide variety, one might need to create ones own Nagios plugin in order to monitor a specific service. The Nagios plugin supports a wide range of programming languages including Bash, Python, Perl, C/C++, etc. But one common fact that needs to be remembered while creating a Nagios plugin using any of the mentioned programming languages is the syntax of the output, which is as follows:
<STATUS> - <DATA TO BE DISPLAYED ON WEB CONSOLE> | <DATA NEEDED FOR GENERATING GRAPHS>
A services STATUS can be OK, WARNING, CRITICAL, or UNKNOWN, which entirely depends upon the corresponding threshold values defined in the script.
Exit status 0 denotes an OK status for the service, which is responsible for highlighting the service check with green on the Nagios Web console. Similarly, exit status 1 denotes the WARNING status of the service highlighted with yellow; exit status 2 denotes the CRITICAL service status highlighted with red; and exit status 3 denotes the UNKNOWN service status highlighted with grey.
Consider that we have to create a custom Nagios plugin to monitor the load average on a Linux server. For this, we need to decide the WARNING and CRITICAL thresholds, which are usually 80 per cent and 90 per cent, respectively, of the number of processor cores available in the system.
The live status of the load average can be obtained from the uptime command, which can then be compared with the threshold levels, to decide the status of the service. Thresholds can be set using the /proc/cpuinfo file, which possesses the necessary information related to the processor installed in the system. There are some conditional statements to compare live values with the threshold values. The echo statements display the service check in the proper format, and a few exit commands help to colour the service check on the Nagios Web console, accordingly.
The sample Bash script will look like whats shown below:
#!/bin/bash
UPTIME=`uptime | awk -F average: {print $2}`
load1=`echo $UPTIME | awk -F, {print $1} | xargs`
load5=`echo $UPTIME | awk -F, {print $2} | xargs`
load15=`echo $UPTIME | awk -F, {print $3} | xargs`
intload1=`echo scale=1; $load1*100 | bc -l | cut -d . -f 1`
intload5=`echo scale=1; $load5*100 | bc -l | cut -d . -f 1`
intload15=`echo scale=1; $load15*100 | bc -l | cut -d . -f 1`
Nprocs=`grep processor /proc/cpuinfo | wc -l`
warn=`scale=1; echo 80 * $Nprocs | bc -l | cut -d . -f 1`
crit=`scale=1; echo 90 * $Nprocs | bc -l | cut -d . -f 1`
actwarn=`echo scale=1; $warn/100 | bc -l`
actcrit=`echo scale=1; $crit/100 | bc -l`
if [ $intload1 -le $warn -a $intload5 -le $warn -a $intload15 -le $warn ]
then
STATUS=OK
EXIT=0
elif [ $intload1 -gt $warn -o $intload5 -gt $warn -o $intload15 -gt $warn ]
then
if [ $intload1 -gt $crit -o $intload5 -gt $crit -o $intload15 -gt $crit ]
then
STATUS=CRITICAL
EXIT=2
else
STATUS=WARNING
EXIT=1
fi
else
STATUS=UNKNOWN
EXIT=3
fi
echo $STATUS- Load Average: $load1, $load5, $load15 |
load1=$load1;$actwarn;$actcrit;; load5=$load5;$actwarn;$actcrit;;
load15=$load15;$actwarn;$actcrit;; && exit $EXIT
When the script is created, it has to be put in the /usr/local/nagios/libexec directory of the Nagios server as well as the clients to be monitored.
To create a command using the custom script, the commands.cfg file needs to be edited.
$ vi /usr/local/nagios/etc/objects/commands.cfg
define command{
command_name check_load_average
command_line $USER1$/check_nrpe -H $HOSTADDRESS$ -c load_average
}
Now, add the above command to the remote hosts service configuration file.
$ vi /usr/local/nagios/etc/objects/services/MyLinuxServer.cfg
define service {
use generic-service
host_name MyLinuxServer
service_description Load Average
check_command check_load_average
}
Restart the Nagios service and perform a check from the command line:
$ /usr/local/nagios/libexec/check_nrpe -H 192.168.0.108 -c load_average
Your custom Nagios plugin has been created.


