DOT is a language you can use to textually represent a graph, so that it can be processed by the dot tool to render the graph as a graphical representation in different formats like .ps, .pdf, etc. It has been developed at AT&T Labs as part of the Graphviz project, which is a collection of tools for graph visualisation. DOT is open source free software published under the Eclipse Public License.
Installation
For the purposes of this article I will use the Ubuntu 14.04 LTS OS version to install DOT; however, you can use any distribution you choose. The dot tool comes with the Graphviz package along with many other graph drawing tools. Run the following command to install Graphviz:
$ sudo apt-get install graphviz
Understanding graphs
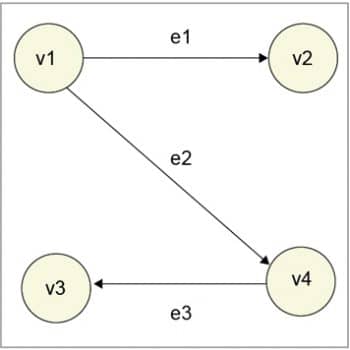
Before we start drawing our first graph, lets first understand what it is, in a non-technical way. A graph G consists of a set of nodes called vertices and a set of edges connecting a pair of vertices. If the edges have direction, it is a directed graph; else, it is an undirected graph. So the diagram in Figure 1 is a directed graph or digraph. v1, v2, v3 and v4 are vertices, and e1, e2 and e3 are edges connecting the ordered vertex-pairs (v1, v2), (v1, v4) and (v4, v3), respectively. All edges have a direction.
Our first graph using DOT
Open a text editor and enter the following code to draw the graph as shown in Figure 1; save it as firstgraph.dot.
digraph G {
v1 -> v2 [label=e1];
v1 -> v4 [label=e2];
v4 -> v3 [label=e3];
}
To generate the graph in PDF format, run the following:
$ dot firstgraph.dot -Tpdf -o firstgraph.pdf
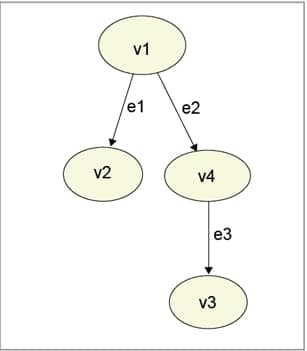
Run the following command to see the graph (Figure 2).
$ evince firstgraph.pdf
Generate an execution flow graph
Now that we know how to draw basic graphs, lets generate a graph for the execution flow of a C program. The following C program oddeven.c checks whether a given integer number is odd or even.
#include<stdio.h>
int main()
{
int num;
printf(\nEnter an integer:);
scanf(%d,&num);
if( num%2==0 )
{
printf(%d is even number\n,num);
}
else
{
printf(%d is odd number\n,num);
}
return 0;
}
This program is so simple, it needs no explanation. We will instrument this program to automatically generate a .dot program file for the execution flow, based on a particular input. Shown below is the instrumented code oddevendot.c
#include<stdio.h>
int main()
{
int num;
FILE *fp;
printf(\nEnter an integer:);
scanf(%d,&num);
if( (fp=fopen(oddeven.dot,w))!=NULL )
{
fprintf(fp,digraph G {\n);
fprintf(fp,\tstart [label=\%d%%2 == 0 ?\]\n,num);
if( num%2==0 )
{
fprintf(fp,\tstart -> end [label=\true\]\n);
printf(%d is even number\n,num);
fprintf(fp,\tend [label=\EVEN\]\n);
}
else
{
fprintf(fp,\tstart -> end [label=\false\]\n);
printf(%d is odd number\n,num);
fprintf(fp,\tend [label=\ODD\]\n);
}
fprintf(fp,}\n);
fclose(fp);
}
else
{
printf(\nfopen() failed\n);
}
return 0;
}
This program generates the dot file oddeven.dot. We will create the PDF graph from this file using DOT. Lets try to run, compile, execute and create the graph as shown below:
$ gcc oddevendot.c -o oddevendot
$ ./oddevendot
Enter an integer:17
17 is odd number
$ dot oddeven.dot -Tpdf -o oddeven.pdf
$ evince oddeven.pdf
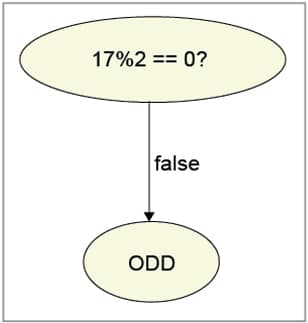
Figure 3 shows the graph that will be displayed. Though this is overkill for such a simple program, it is only to demonstrate the usefulness of the programmatic way of drawing graphs.
I have only covered a very few features of the DOT language. Please explore the resources to find out how powerful and flexible the language is. You can also explore the neato tool Graphviz package for drawing undirected graphs.
References
[1] http://www.graphviz.org/
[2] https://reference.wolfram.com/language/ref/format/DOT.html


