


Prometheus is a leading monitoring solution that has seen its community grow to large numbers. The support for multiple exporters is one of the strongest points of Prometheus, since it can help you get started with specific monitoring requirements quickly.
Prometheus is a leading open source monitoring and alerting tool. It had its origins at SoundCloud and has seen significant adoption since it was announced in 2015. The software was created because of the need to monitor multiple microservices that might be running in your system. Its architecture is modular and comes with several readily available modules called exporters, which help you capture metrics from the most popular software. It is written in the Go language, and it ships with easily distributed binaries that you can use to get it running as quickly as possible.
This article looks at Prometheus, its architecture and how it can be installed. We then look at an example of monitoring your Linux node with the default support that is available out-of-the-box with Prometheus.
Prometheus’ architecture
The architecture of Prometheus, taken from the official documentation, is shown in Figure 1.
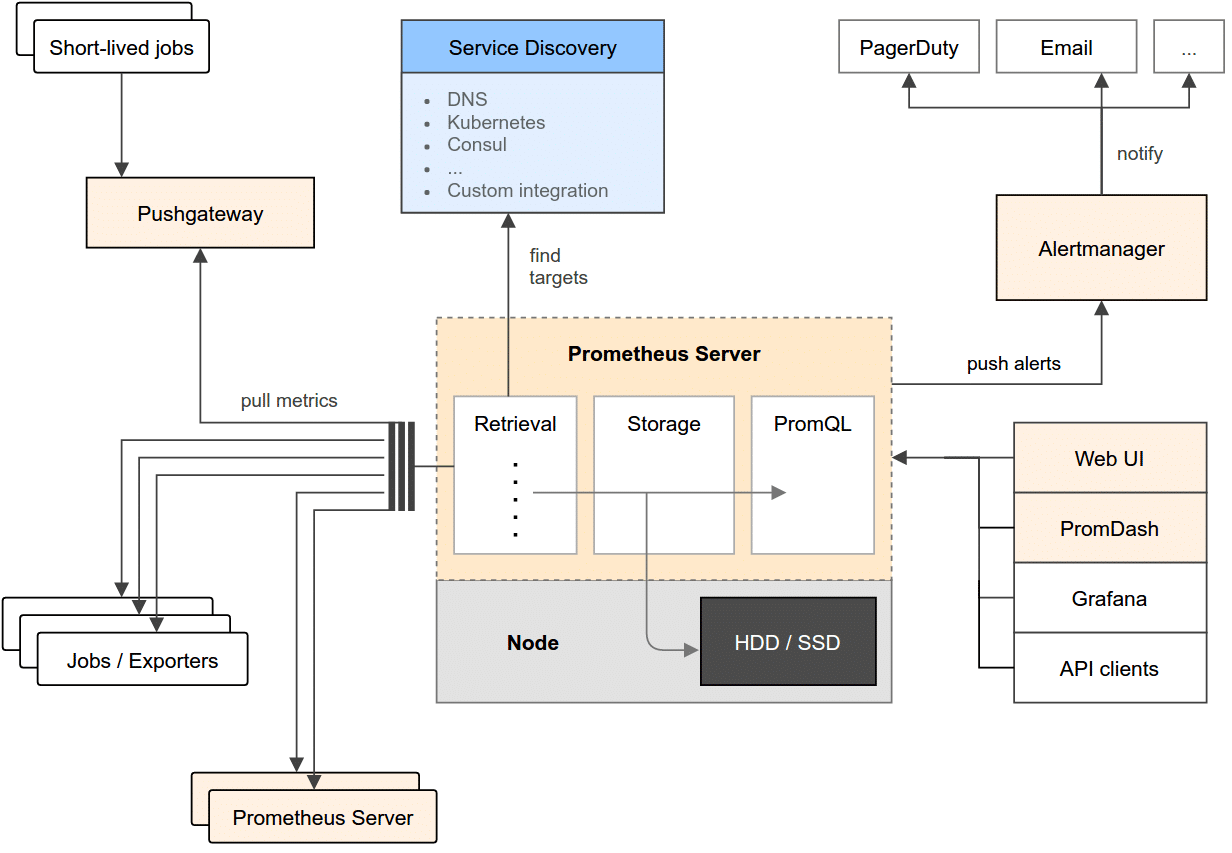
The architecture might look complex but we can break it down into modules and their respective roles in the overall system. The key modules are as follows.
The Prometheus server
This is the heart of the system. This server collects the metrics from multiple nodes and stores them locally. The Prometheus server works on the principle of scraping, i.e., invoking the metrics endpoints of the various nodes that it is configured to monitor. It collects these metrics at regular intervals and stores them locally. These metrics are pulled from nodes that run specific exporters (which are modules that extract information and translate it into its format, which the server can then ingest). The nodes expose these over the endpoints that the Prometheus server scrapes.
Push gateway
In case the nodes are not exposing an endpoint from which the Prometheus server can collect the metrics, the Prometheus ecosystem has a push gateway. This gateway API is useful for one-off jobs that run, capture the data, transform that data into its data format and then push that data into the Prometheus server.
Alert manager
One half of the Prometheus system is about collecting metrics. But of more importance is the ability to define your own alerts on those metrics, so that you can be notified in case of any discrepancies or levels that you might be interested in. This is the job of the alerts manager, which stores not just the alert levels but also can deliver these alerts to you over multiple channels like SMS, email, Slack, etc.
Visualisation
Prometheus comes with its own user interface that you can use to check on the configuration, nodes and graphs. Additionally, it is now compatible with Grafana, a leading open source visualisation application, so that Prometheus data is available for viewing inside Grafana. It also exposes an API, so in case you are interested in writing your own clients, you can do that too.
Installing Prometheus and node exporter
We will now install Prometheus and one of the exporters called the node exporter. The node exporter is an application that runs on a node and can collect various metrics like memory, disk I/O and more. It also exposes an endpoint, which the Prometheus server scrapes at regular intervals and collects the metrics.
Visit the Prometheus downloads page and you will see the binaries made available and various other modules like the alerts manager, node exporter and more.
Assuming that you want to install the Prometheus server on a Linux distribution, download the Prometheus server as shown below:
wget "https://github.com/prometheus/prometheus/releases/download/v1.5.0/prometheus-1.5
.0.linux-amd64.tar.gz"
Extract the files into a folder and, at the root of that folder, you should see the following key files: prometheus and prometheus.yml.
Now, let us go and download the node exporter as shown below:
wget "https://github.com/prometheus/node_exporter/releases/download/v0.13.0/node_exporter-0.13.0.darwin-amd64.tar.gz"
Extract the files into a folder and, at the root of that folder, you should see the following key file: node_exporter.
Monitoring your node with Prometheus
In the earlier section on architecture, we saw that the Prometheus server can collect metrics from multiple nodes that need to be monitored. In our example here, we will monitor the server itself. We will execute these programs on the same node, for the sake of simplicity.
The first thing that we shall run is the node_exporter. The node exporter collects multiple metrics about the node like memory, disk I/O, processes and more. To run the node exporter, go ahead and run the node_exporter program that you just downloaded. The output is shown below:
$ ./node_exporter &
[1] 484
romin_irani@promserver:~/Prometheus/node_exporter/node_exporter-0.13.0.linux-amd64$ INFO[0000] Starting node_exporter (version=
0.13.0, branch=master, revision=006d1c7922b765f458fe9b92ce646641bded0f52) source=node_exporter.go:135
INFO[0000] Build context (go=go1.7.3, user=root@75db7098576a, date=20161126-13:11:09) source=node_exporter.go:136
INFO[0000] No directory specified, see --collector.textfile.directory source=textfile.go:57
INFO[0000] Enabled collectors: source=node_exporter.go:155
INFO[0000] - mdadm source=node_exporter.go:157
INFO[0000] - meminfo source=node_exporter.go:157
INFO[0000] - vmstat source=node_exporter.go:157
INFO[0000] - loadavg source=node_exporter.go:157
INFO[0000] - entropy source=node_exporter.go:157
INFO[0000] - filefd source=node_exporter.go:157
INFO[0000] - netdev source=node_exporter.go:157
INFO[0000] - sockstat source=node_exporter.go:157
INFO[0000] - textfile source=node_exporter.go:157
INFO[0000] - diskstats source=node_exporter.go:157
INFO[0000] - netstat source=node_exporter.go:157
INFO[0000] - filesystem source=node_exporter.go:157
INFO[0000] - hwmon source=node_exporter.go:157
INFO[0000] - stat source=node_exporter.go:157
INFO[0000] - time source=node_exporter.go:157
INFO[0000] - uname source=node_exporter.go:157
INFO[0000] - conntrack source=node_exporter.go:157
INFO[0000] Listening on :9100 source=node_exporter.go:176
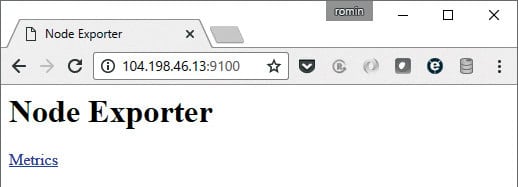
You will notice that the node exporter has started to collect various metrics and has exposed a Prometheus metrics data compatible endpoint on port 9100. If we visit the endpoint http://<your-node-ip>:9100, you will see the node endpoint as shown in Figure 2.
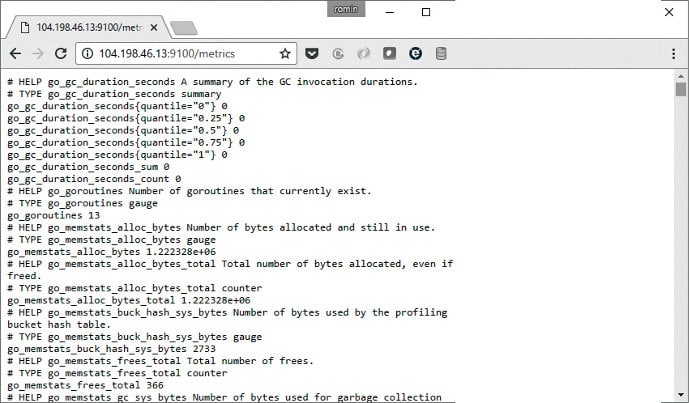
Click on the Metrics link and it will display multiple metrics that are captured. A sample screenshot is shown in Figure 3.
Now that the node exporter is working fine, let us start the Prometheus server. Before we start the Prometheus server, we need to identify the nodes from which it will scrape the node metrics.
Go to the folder into which you extracted the core Prometheus server files, i.e., prometheus and prometheus.yml. The YAML file is the key configuration file and will define multiple targets that the Prometheus server needs to scrape. In addition to targets, it can also have multiple other configuration entries like alerts, default time intervals, etc.
Since we are only interested in monitoring one node, which is running locally for the moment, the prometheus.yml file is shown below:
#my global config
global:
scrape_interval: 15s
evaluation_interval: 15s
scrape_configs:
- job_name: 'node'
static_configs:
- targets: ['localhost:9100']
Now, let us launch the Prometheus server as shown below:
$ ./prometheus
INFO[0000] Starting prometheus (version=1.5.0, branch=master, revision=d840f2c400629a846b210cf58d65b9fbae0f1d5c) source=main.go:75
INFO[0000] Build context (go=go1.7.4, user=root@a04ed5b536e3, date=20170123-13:56:24) source=main.go:76
INFO[0000] Loading configuration file prometheus.yml source=main.go:248
INFO[0000] Loading series map and head chunks... source=storage.go:373
INFO[0001] 1203 series loaded. source=storage.go:378
INFO[0001] Starting target manager... source=targetmanager.go:61
INFO[0001] Listening on :9090 source=web.go:259
You can see that the server is listening on port 9090, and we can use that information to take a peek into its default Web user interface (UI).
Visit the endpoint on port 9090 as shown in Figure 4.
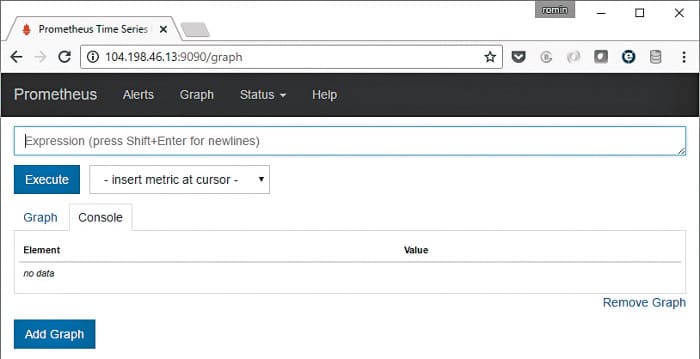
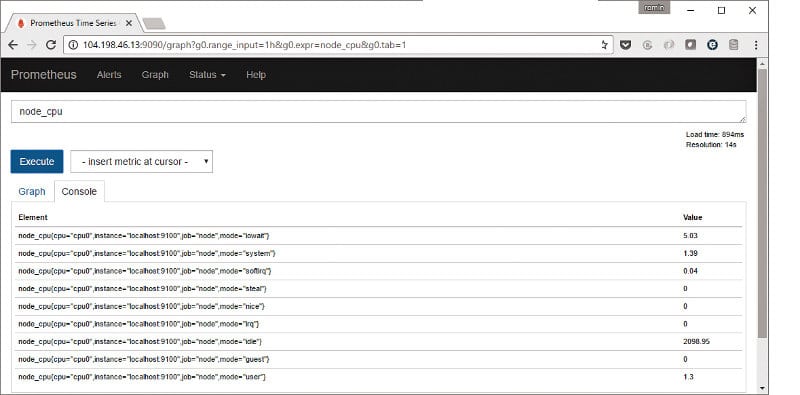
You can now enter an expression for one of the metrics that you want to take a look at — for example, the node CPU metrics, which is shown in Figure 5. Just select it in the expressions list and click on the Execute button, as shown in the figure.
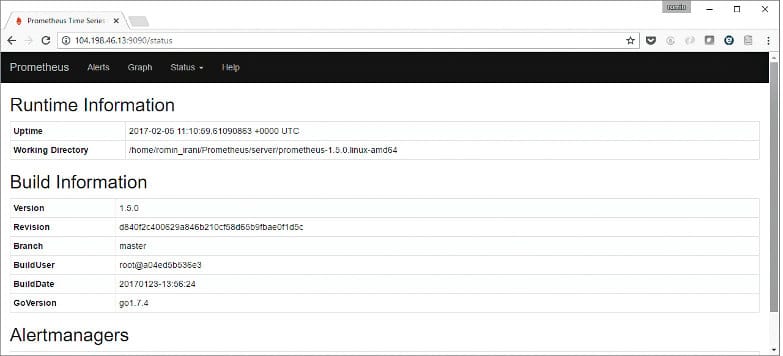
There is useful information in the Status menu option also. You can view your configuration, rules, alerts and targets from there. The default information is shown in Figure 6.
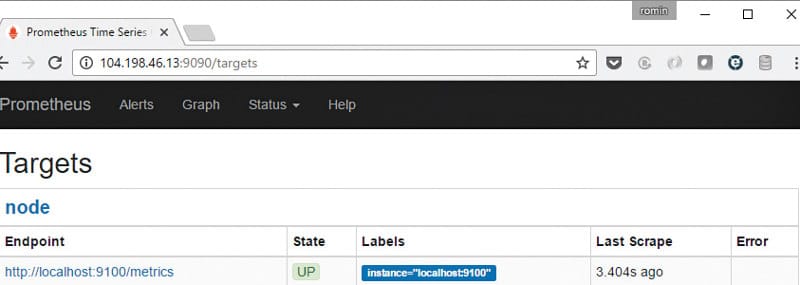
You can click on the Targets link in the Status main menu to see the targets that you have configured. Since we have configured only one target, that is what we see (Figure 7).
You can view the nodes from the Prometheus UI by visiting /consoles/node.html endpoint as shown in Figure 8.
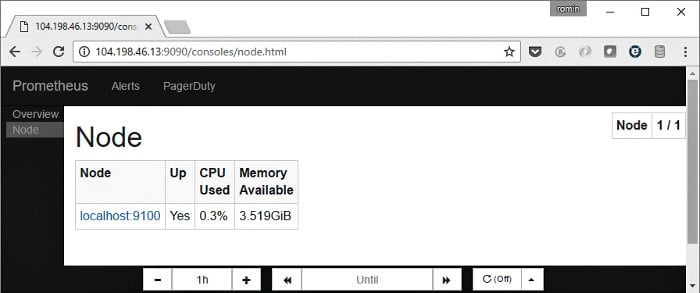
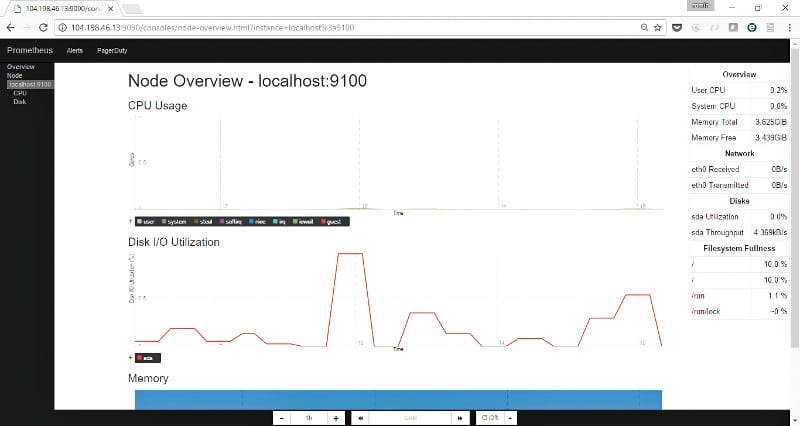
You can now click on the Node link to see more metrics about the node.
This completes the steps on validating your basic Prometheus set-up. We have only touched upon the surface of this topic. Your next steps should be to assess the several exporters that are available and see which ones address your monitoring requirements, along with any alerts that you would like to set up for your environment.
Cloud Native Computing Foundation (CNCF) and Prometheus
The Cloud Native Computing Foundation (CNCF) is, according to its website, a non-profit organisation committed to advancing the development of cloud native applications and services by creating a new set of common container technologies guided by technical merit and end user value, and inspired by Internet-scale computing.
The first project to be accepted by this foundation was Kubernetes, which is the leading open source solution for container orchestration. It has been accepted as the second project by this foundation, and that speaks volumes about its functionality and its acceptance as a standard in monitoring applications and microservices.
It integrates with CNCF’s first hosted project, Kubernetes, to support service discovery and monitoring of dynamically scheduled services. Kubernetes also supports Prometheus natively.
Contributing to Prometheus
One of the key reasons for its growth has been the contributions it has received from the community. But often, it is a challenge to understand how you can get started with contributing to some of its core modules. In an article published at NewStack, titled ‘Contributing to Prometheus: An Open Source Tutorial’, the writer takes up the architecture of the alerts manager and breaks down that module to help us understand how it works and the potential ways in which we can contribute.
Having been accepted by the Cloud Native Computing Foundation, it would help tremendously to contribute to this project, since the visibility of your contribution will be very high.


