Synthetic Aperture Radar (SAR) is used to create 2D or 3D images of an object. Processing of SAR data can help to show how such imagery is formed. This article on the free and open source PolSARpro will interest students, researchers, and those interested in becoming remote sensing specialists or SAR system designers.
Developed under a contract with ESA (European Space Agency)-ESRIN (ESA Centre for Space Observation), PolSARpro is a polarimetric Synthetic Aperture Radar (SAR) data processing and education tool. Most of the SAR sensors provide data at two different levels. Level 1 is complex raw data and needs a lot of mathematical and physical understanding of the phenomenon before it can be used. Level 2, on the other hand, is calibrated, geo-referenced data and a majority of the processing is image processing. In this article, we demonstrate Level 1 SAR processing through FOSS PolSARpro ver 5.1.
PolSARpro supports data processing of both airborne and space-borne radars. Table 1 lists the airborne and space-borne satellites launched by the national space exploration programmes of various countries.
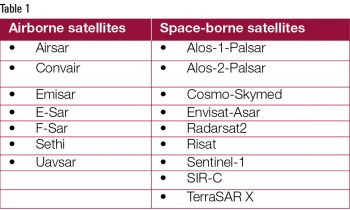 Among the above mentioned satellites, data of Sentinel-1a, Sentinel-1b, Uavsar and Alos Palsar is freely available.
Processing capabilities of PolSARpro
PolSARpro is packed with tools for the smoothening of images and for speckle removal. Many filters, such as An-Yang filter, Box-car filter, Box-car Edge filter, Gaussian filter, IDAN filter, Lee Refined filter, Lee Sigma filter, Lopex filter, Mean-Shift filter, Non-local Means filter, etc, are available at your fingertips while working with this FOSS solution.
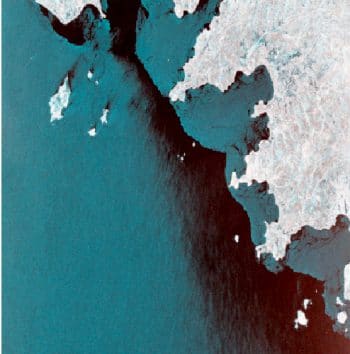
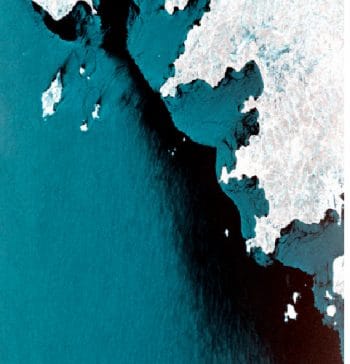
For visual appeal, you will find the Refined Lee filter applied on a SAR image in Figure 2.
There are significant decomposition algorithms available for quadrature polarimetric data, dual polarimetric data as well as compact polarimetric data. These decomposition algorithms help the study of particular features like ship detection, oil spill detection, agricultural applications, etc. A rich set of popular decomposition algorithms is available with PolSARpro. A few of them are listed in Table 2.
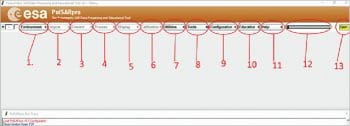
![]() A step-by-step decomposition of SAR data through PolSARpro version 5.1 is shown via the home screen of this version.
A step-by-step decomposition of SAR data through PolSARpro version 5.1 is shown via the home screen of this version.
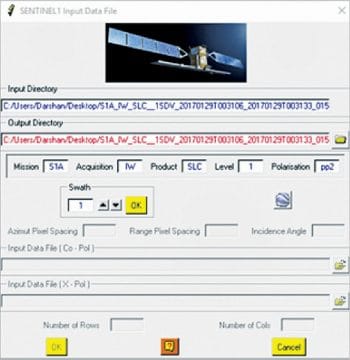
The first step is to select the environment. The first active tab shown in Figure 3 gives options to select a single data set, dual data set or multi-data set. Select the single data set if you want to process only a single scene or a single SAR image. Select an appropriate folder location. The environment folder selection depends on a particular satellite that one wants to work with. Let’s take the example of Sentinel-1 SAR SLC level 1 data (Sentinel data is freely available as discussed earlier). After selecting the environment, the import tab (No. 2 in Figure 3) will be activated. For Sentinel-1, select Import → Spaceborne Sensors → Sentinel-1 → Unzipped data product.
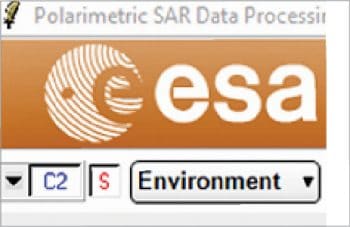
Select the swath number, as Sentinel data contains three swaths in a single data set. This window differs according to different sensors. It will take time to process depending on the user’s hardware and the size of the data. After importing data, select Import → Extract PolSAR images. This will give you the option to create a covariance matrix. If it is quad pole data, then multiple options like T3, C3, C2, Sinclair, etc, will be shown. These matrices are the ‘BASE’ for further processing of the same data, and are now keys for further processing like decomposition, classification, etc. All the tabs will now be activated, including ‘Process’ (No. 4 in Figure 1). Make sure that the matrix you are working on appears at the bottom left, as shown in Figure 5. Whatever process one selects will be applied to the matrix mentioned in the box (C2, in this example).
When you press the ‘Process’ tab, all the possible speckle filtering algorithms, decomposition algorithms, classification algorithms, etc, will be visible. Now, from here it’s up to you! You can try as many decompositions, filters and classifications that interest you or are relevant to your field.
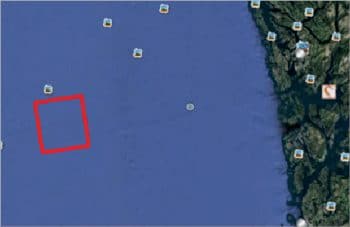
One of the features of PolSARpro is that it creates a KML file which can be seen on the Google Earth application. The Google Earth app can also be linked with PolSARpro software during installation. This KML file shows the highlighted location of the SAR image on Google Earth. A sample of the highlighted image is shown in Figure 6.
![]() A few segmentation algorithms are listed in Table 3.
A few segmentation algorithms are listed in Table 3.
Scatter plots can also be generated using any two entities such as the X-axis and Y-axis.
In short, there is a lot more that you can do with PolSARpro, which is not possible to cover in this article. The more you explore, the more functionalities you will discover. Have a happy time exploring PolSARpro!


