The essence of writing code is to also be able to debug it. Debugging programs not only help to remove kinks from the code, but also hone the skills of the code writer. This article discusses various debugging tools and techniques to enable code writers to improve their skills.
Software bugs have caused all kinds of disasters — from the failure of multi-million dollar space projects to the death of patients in hospitals. But most of the time, we reach the perfect code only after writing bugs first and then fixing them. Even good planning and algorithms cannot foresee some runtime misfortunes. The only thing we can do is to get armed with good debugging skills.
There are user-friendly IDEs with simple Play buttons to help you start debugging, and Web browsers have made such features a part of our day-to-day browsing experience. But if you have skipped the basics and moved straight to these fancy tools, give the classic tools like printf and GDB a try, and you will feel you have spent your time well.
Writing code that makes sense
There might be a hundred tools to help you debug your program, from printf to GDB, or some fancy graphical stuff. But a productive debugging session requires your code to be readable. A code that doesn’t reveal the hierarchy, control flow, or the meaning of variables, functions and other resources can leave you frustrated, giving the false impression that you and your debugger are useless, or that a simple missing-braces issue is a ghost that can never ever be caught.
Choose a coding standard for yourself. Proper indentation can help you understand the control flow and scope. It has often been observed that adding indentation to an erroneous program reveals the mistakes automatically, even causing you to fix them unconsciously. If you’d like to get automatic indentation for the C code that you have already written, you can use GNU indent, an FSF implementation of the UNIX indent command.
Names should be as meaningful as possible and even the letter case you choose should matter. For example, you can choose full-upper-case to name constants.
Finally, split your code into multiple functions and files, with proper custom header files, as needed.
printf debugging
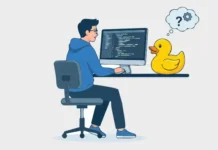
As its name suggests, this is the practice of inserting output statements in usually unwanted places to monitor intermediate values. This is perhaps the most simple, yet effective method of debugging (arguably after Rubber Duck debugging). In fact, it is the favourite debugging tool of some famous programmers, as we will soon see.
Some of the major uses of printf debugging are:
- To ensure that the program control reaches a particular block and statement
- To ensure that a loop control variable goes in the right order
- To ensure that a pointer isn’t NULL before dereferencing it
- To ensure that function calls, especially recursion, get executed in the right order with the right parameters
- To check the return values of library calls in order to identify improper use of the API
The first point on the above list is really important in solving many logical errors, which may puzzle us without leaving any visible error messages. For example, if the file handling code in the following snippet doesn’t seem to work as intended, we may find a thousand reasons for this, including permission issues, file system issues and mishandling of the API:
if (condition) {

// multiple lines of complicated file handling code

}
But a simple printf (“I’m here!\n”) inside the if block will let us know whether we will ever reach there, revealing the issues with the if condition and the previous code that prepares it.
Note: Don’t forget to append your printf message with a newline character or you won’t get the output before the program crashes. This is because stdout is mostly line-buffered and characters are not displayed on the screen until a ‘\n’ is encountered. Other options are to use fflush(stdout) after the printf statement or fprintf(stderr, fmt, …) instead of printf, since stderr is unbuffered.
For one more example, let’s consider string functions. There is a good chance for string functions to cause an abrupt segmentation fault either because the given string pointer was NULL or because the string lacked the null character at the end. The following code will let you know what happened:
printf (“String pointer = %p\n”, str);

printf (“length = %d\n”, strlen (str));

// actual operation with str
The first printf will let you know if you are dealing with a NULL pointer. If the second one gives you no output or something insane, you can be sure that the string lacks a null character at the end (a short-cut instead of running a loop to check each character).
Conditional compiling
Unlike the printf lines that you add when there is an issue and remove once it is fixed, you might want some logging code to be always there, active throughout the development/maintenance cycle. Adding it before each coding cycle and removing it just before the production build is a horrible idea, and that’s where you can rely on the power of the C preprocessor.
The basic concept is to wrap the debug code inside a #if block that checks for a macro, which is only defined for debug builds.
// production code

#ifdef MYDEBUG

// logging code

#endif

// production code
You can compile this using gcc with the option –DMYDEBUG (which defines the macro MYDEBUG) during development in order to get the logging code compiled.
A cleaner approach would be to create a header file debug.h as follows:
#ifndef _MYDEBUG_H

#define _MYDEBUG_H

#ifdef MYDEBUG

#include <stdio.h>

#define log_printf(...) printf(__VA_ARGS__)

#else

#define log_printf

#endif

#endif
It still requires you to compile with –DMYDEBUG, but the beauty is that wherever you include this header file, you can use the function log_printf without additional checking, which will vanish magically if it is a production build. Let’s look at the example below:
#include <stdio.h>

#include "debug.h"

int main() {

puts ("This is production code");

log_printf ("This is debug log that will vanish if you don’t compile with -DMYDEBUG\n");

return 0;

}
If you compile this without -DMYDEBUG, you won’t get the log_printf message.
Write a Makefile to automate the process
Let’s write a Makefile to automate our debug build. This example is really inferior to the Makefile standards but useful to illustrate the concept we are discussing.
ifdef debug

CFLAGS = -Wall -g -DMYDEBUG

else

CFLAGS = -Wall

endif

all:myprogram

myprogram:main.c debug.h

cc -o myprogram main.c $(CFLAGS)

clean:

rm -rf myprogram
You can save this file as Makefile in the same directory where main.c resides, and run it using the following commands.
For debug build:
make myprogram debug=1
For production build:
make myprogram
It is clear from the above snippets that debug=1 causes CFLAGS to include the option -DMYDEBUG, which will cause the C compiler to compile the lines that you placed under #ifdef MYDEBUG. You might have noticed an additional option -g, which is not necessary here, but will be useful while dealing with debuggers.
Note: Do not forget to run make clean before making a production build after a debug build, and vice versa.
Why you need a debugger
You can’t make use of printf debugging without having spotted some suspicious code already, unless you are ready to insert it in every other line. On the other hand, a debugger lets you do the following:
- Identify the exact line of code where a fatal error occurs
- Set breakpoints
- Watch the values and status of variables (including human-readable status of a structure variable) at crashes and breakpoints
- Get the stack trace, function backtracks and live CPU register status
- Make real-time edits to the program
To quote Richard Stallman’s words from the GDB (GNU Debugger) manual, “The purpose of a debugger such as GDB is to allow you to see what is going on inside another program while it executes—or what another program was doing at the moment it crashed.”
The most important advantage is that you don’t have to add any additional code to your program in order to make it debuggable. Any program compiled with a simple debug flag can be run and analysed using a debugger.
If you find classical languages like C to be unfriendly compared to the modern ones like Python, you are going to have a rethink after using a debugger for the first time.
Why you may not need a debugger
Not all programmers like debuggers. This includes Linus Torvalds, Guido van Rossum and Brian Kernighan. Rossum is said to use print statements for 90 per cent of his debugging.
One reason not to use debuggers is the ease they provide, which helps you fix the last erroneous lines easily while leaving other non-fatal issues unnoticed. On the other hand, if you go through each and every line without the precise information that a debugger provides, there is a chance you might notice more logical errors. Even if there are no other errors, you’ll end up rewriting parts for clarity, efficiency and robustness, while searching for errors.
Moreover, debuggers sometimes tend to be less productive, presenting you with such a comprehensive error report, that understanding it requires more time than writing a hundred printf lines.
But debuggers are not a total waste of time. They are the best choice to give you a stack trace, backtrack or live CPU register status. My personal advice is to learn them and use them like secret weapons, not like daily tools. Also, you can consider using one as your primary debugging tool for one week or so, in order to understand the usual mistakes you make, and you can be a better printf debugger afterwards.
Compiling with the debug flag
Adding -g option to the gcc command will cause the program to be compiled with debugging information, which is required if you want to communicate with the debugger in terms of human-readable information like the source file name, line number, identifiers and the source line itself.
Here is an example:
gcc -o myprogram -g main.c
|
Getting started with GDB
GDB, the GNU Debugger, is a free software portable debugger that supports multiple languages including C, C++, Go, Fortran and Java. If it doesn’t come as part of your GNU/Linux distro, you can install the package gdb from its official repository. Windows users will have to rely on the MinGW variant.
Once you’ve compiled your program with the Debug flag, you can start GDB with your program loaded using the following command:
gdb PATH_TO_YOUR_PROGRAM
(The path can be relative; just the file name would do if you are in the same directory.)
Once started, GDB behaves like a command shell — it waits for your command, executes it and again waits. If you haven’t given the program name with the gdb command, you can give it after GDB has started:
(gdb) file PATH_TO_YOUR_PROGRAM
(Please note that (gdb) is just a prompt, not part of the command you give).
run (shorthand: r) is the command to run your program. So all you have to do is type r and hit Enter. If everything goes well, you get your program’s output, appended with GDB information on its termination (return values, premature ending, etc). You are then brought back to the GDB shell.
[Inferior 1 (process 7361) exited normally]

(gdb)
The above output shows that Inferior 1, our program, exits normally. If your program crashes somewhere in the middle, you are brought back to the GDB shell with an error message. Here you can perform a backtrack, monitor all the variables and registers, or restart the execution. If you want to have a similar monitoring by intentionally pausing at some particular points, you can set breakpoints. You can also press Ctrl+C, which might be a wild and inaccurate action, but don’t do so unless you are stuck in an infinite loop or something like that. Consider the following code:
int main() {

char *str = 0;

puts(str);

return 0;

}
And now see what happens in the GDB shell:
(gdb) r

Starting program: /tmp/a.out

Program received signal SIGSEGV, Segmentation fault.

__strlen_sse2 () at ../sysdeps/x86_64/multiarch/../strlen.S:120

120 ../sysdeps/x86_64/multiarch/../strlen.S: No such file or directory.

(gdb)
That doesn’t make much sense, except that a segmentation fault has happened. Now you can give the backtrack (bt) command:
(gdb) bt

#0 __strlen_sse2 () at ../sysdeps/x86_64/multiarch/../strlen.S:120

#1 0x00007ffff7a6d472 in _IO_puts (str=0x0) at ioputs.c:35

#2 0x0000555555554656 in main () at a.c:3

(gdb)
Now it is clear that it was caused by calling puts() with a NULL pointer, and it happened in main () at a.c:3.
You can use the quit (q) command to exit from GDB. But quitting GDB is not necessary to go and make changes to your program. Once you come back, you can use r to restart your program. You can even use make to recompile your program (if you have a Makefile).
Perhaps the most useful command is help (h), which is really informative. You can try help breakpoints, help status, etc. Try help info to learn about the useful info (i) command.
The GDB print command
You can use the print (p) command to get the value of a variable at a crash or breakpoint, if it is in the current scope (not in the above example since the crash happens in the library). You can also use the C member selection and de-referencing operators with it. For example, p ptr will print the address pointed by ptr while p *ptr will print the value pointed by it.
GDB manages to get detailed with structure members:
(gdb) p *token_new

$1 = {type = NAN_TOK_TYPE_PREPRODIR, token = {

str = 0x7fff00000007 \, keyword = NAN_KW_LONG, preprodir = NAN_PREPRODIR_IFNDEF,

punctuator = NAN_PUN_ARROW, macro_argpos = 7}, where = {

file = 0x555555765ad0, line = 1, col = 8028058262076924005},

global_str_literal_name = 0x0, next = 0x0}
Another advantage is the readability. In the above examples, many of the structure members have enum members assigned to them. GDB prints the human-readable names of them, where printf can only give you the integer values they represent.
Breakpoints in GDB
To start with, you can set breakpoints in the GDB shell using b file:line or b functionname. Now you can run the program as usual. Once the program reaches the specified lines, it pauses and lets you perform various status checks. You can continue using the continue (c) command or delete the breakpoint at that line using the clear command, once you are done. clear file:line will delete the breakpoint in a specific line while clear functionname will delete all the breakpoints under it.
The delete breakpointnumber command (shorthand: d) will delete the specified breakpoint while the same command with no breakpoint number will delete all the breakpoints with a confirmation.
The very next step with GDB is perhaps Stepping, which lets you step through your program, line by line, without setting a thousand breakpoints. But this is out of the scope of this article, and we are leaving GDB here.
Let’s now list some utilities that will help you deal with programs written in C and much lower-order languages:
- strace — to trace system calls and signals
- objdump — to display information from object files, including disassembly
- mtrace — to find memory leaks
- hexdump — ASCII, decimal, hexadecimal, octal dump, especially to analyse binary files
- Static code analysis tools and visualisers


