Containers as microservice-based technology have a significant role in virtualising cloud applications. This article takes a quick look at the most popular performance monitoring tools for container technology that can ease the task of IT admins.
Containerisation is a technology to virtualise applications in a lightweight way that consumes less resources and time. This has led to the development of various container technologies like LXC, Docker and RKT. All these technologies work on the same principle — that the applications can share their host OS kernel and contains only appropriates binaries and libraries, making it smaller in size compared to a virtual machine.

Why monitoring of containers is important
The monitoring of containers plays a significant role for developers because it gives a quick overview of the running applications and ensures that containers are meeting their expected goals. This helps to catch problems early and resolve issues quickly.
Popular tools for performance monitoring of containers
As containers run in their own namespaces, traditional Linux monitoring tools such as top, ps, tcpdump and lsof, from the host system, do not help to monitor the activity happening within a container. A proper understanding of the following tools will help researchers, practitioners and developers efficiently monitor the applications deployed on the container virtualisation platform. So let’s look at these popular container monitoring tools and their installation steps.
Docker Stats
To monitor resource usage of Docker containers, the simple solution is the Docker stats command. It is an open source default API available in the Docker daemon, and provides resource usage statistics of a running Docker container in terms of CPU, RAM, network, and block I/O usage. The following command can be used to get performance metrics of a running Docker container, as depicted in Figure 1:
$ docker stats container name

cAdvisor
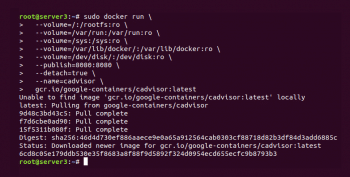
cAdvisor stands for container advisor and was created by Google in 2014. It is also an open source tool to monitor Docker containers. However, compared to Docker Stats, which is based on the command line interface (CLI), cAdvisor also provides a GUI for viewing API information. In cAdvisor, the isolation of the shared resources used by multiple container applications is based on lmctfy’s API. To set up and run cAdvisor, execute the following commands, as shown in Figure 2:
$ docker run\

--volume=/:/rootfs:ro\

--volume=/var/run:/var/run:rw \

--volume=/sys:/sys:ro \

--volume=/var/lib/docker/:/var/lib/docker:ro \

--publish=8080:8080 \  --detach=true \

--name=cadvisor \

google/cadvisor:latest
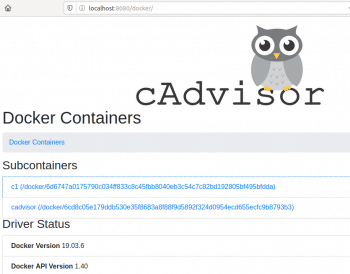
cAdvisor can now be accessed at http://localhost:8080, as shown in Figure 3.
Prometheus
Prometheus is another GUI based open source tool for monitoring Docker containers and was developed by SoundCloud. Along with Docker Stats and cAdvisor, Prometheus also provides an alert mechanism based on some applied rules. It makes use of the exporter API to capture and store container metrics. The installation of this container monitoring tool can be done by executing the following commands.
Step 1: Download the latest release of Prometheus, and then extract it:
$ tar xvfz prometheus-*.tar.gz

$ cd prometheus-*
Step 2: Change to the directory containing the source code of Prometheus and run the following command, as depicted in Figure 4:
$ ./prometheus - -config.file = prometheus.yml
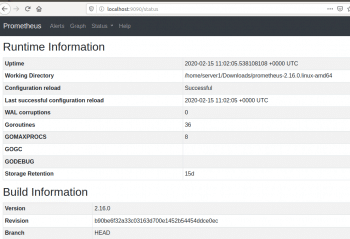
Prometheus can be accessed at http://localhost:9090, as shown in Figure 5.
Sensu
Sensu is a container monitoring tool that provides support for all three container technologies, namely LXC, Docker, and RKT. Sensu is self-hosted and offers centralised metrics services. However, in the production environment, the deployment of this tool depends upon various complementary services such as Sensu API and Sensu Core, as shown in Figure 6. The Sensu monitoring tool can be installed using the following commands.
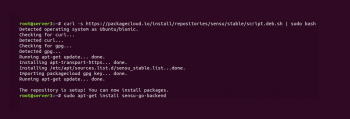
Step 1: Install the Sensu backend, as follows. Add the Sensu repository:
curl -s https://packagecloud.io/install/repositories/sensu/stable/script.deb.sh | sudo bash
Next, install the sensu-go-backend package:
sudo apt-get install sensu-go-backend
Step 2: Install sensuctl. Add the Sensu repository:
$ curl -s https://packagecloud.io/install/repositories/sensu/stable/script.deb.sh | sudo bash
Next, install the sensu-go-cli package:
$ sudo apt-get install sensu-go-cli
Step 3: Install Sensu agents. Add the Sensu repository:
$ curl -s https://packagecloud.io/install/repositories/sensu/stable/script.deb.sh | sudo bash
Next, install the sensu-go-agent package:
$ sudo apt-get install sensu-go-agent
Start sensu-agent using a service manager:
$ service sensu-agent start

Sysdig
Sysdig is the most widely adopted container monitoring tool that provides support for alerts, data aggregation and visualisation. It is easy to deploy and provides a simple interface, where users can see the information about the CPU, memory and network usage. Thus, Sysdig is one of the good choices to monitor the performance of running container technology. It can be installed by executing the following commands:
$ curl -s https://s3.amazonaws.com/download.draios.com/stable/install-sysdig | bash

$ csysdig –vcontainers
A screenshot of the dashboard of this container monitoring tool is shown in Figure 7.
In the landscape of container technology, making a informed refined choice from the variety of container monitoring tools is the need of the hour. This article will help IT admin, to make an informed choice about the better container performance monitoring tools that can be deployed easily with features of alert mechanism, support for different data types, and dashboard visualisation.


