


The ubiquitous usage of Kubernetes necessitates accurate and timely monitoring of its clusters. Prometheus and Sensu are the tools to latch on to for this.
Development combined with operations leads to the high impact DevOps practices, and microservices based architecture is ubiquitous in such an environment. Although such architecture is not new — it’s been around since the 1980s – the DevOps practice is relatively new. The idea of DevOps began in 2008 with a discussion between Patrick Debois and Andrew Clay Shafer, concerning the concept of agile infrastructure. In June 2009, the epochal presentation of ‘10+ Deploys a Day: Dev and Ops Cooperation’ was made at Flickr by John Allspaw and Paul Hammond. That year can be treated as the year the DevOps movement began. The Linux containerisation technology based Docker came into play in 2013. In 2014, we saw the journey of Kubernetes begin as an orchestration attempt of multiple Docker containers from Google. Subsequently, Kubernetes began to be maintained by the Cloud Native Computing Foundation (CNCF). The consequent proliferation of Kubernetes led to the absolute necessity of monitoring its deployment in DevOps. This resulted in open source tools like Prometheus and Sensu, along with the older Nagios. Let’s take a closer look at Prometheus, while getting the basics on Sensu.
Monitoring tools
We typically talk about the following three tools in the context of Kubernetes monitoring.
- Prometheus: This open source Kubernetes monitoring tool collects the metrics of Kubernetes deployment from various components, relying on the pull method. The data is stored in an inbuilt time series database.
- Sensu: This complements Prometheus. It provides flexibility and scalability to measure the telemetry and execute service checks. The collected data can be more contextual here, and it is possible to extend it to provide automatic remediation workflows as well.
- Nagios: This is the old friend we used to monitor deployments. It serves its purpose well, especially in the context of bare metal deployments to a host of administrators.
Kubernetes monitoring challenges
When we decide to go with Kubernetes, we are ready to embrace the mantra that the only constant in life is change. Naturally, this adds associated challenges with respect to monitoring Kubernetes deployments. Let’s discuss a few monitoring challenges to understand them better.
- The apps are ever evolving; they are always moving.
- There are many moving pieces to monitor. Kubernetes is not really a monolithic architectural tool, as we all know. Those components also keep on changing.
- Once upon a time, everything was server based, often bare metal. Then we got cloud based deployment. The natural progression makes multi-cloud a reality, which adds an extra facet to the monitoring challenges.
- We typically annotate and tag the pods and containers in a Kubernetes deployment to give them nicknames. The monitoring should reflect the same.
Kubernetes data sources
Once we understand the challenges of monitoring in a Kubernetes environment, we need to understand the moving parts of a typical, sizable deployment. These moving parts are the data sources from which Prometheus pulls the monitoring metrices.
- The hosts (nodes) which are running the Kubelets.
- The process associated with Kubelets — the Kubelet metrices.
- Kubelet’s build in the cAdvisor data source.
- The Kubernetes cluster. This is the whole deployment. From a monitoring perspective, these are Kube state metrices.
The good part is that Prometheus can monitor all of the above, addressing all the monitoring challenges we described earlier.
The Prometheus architecture
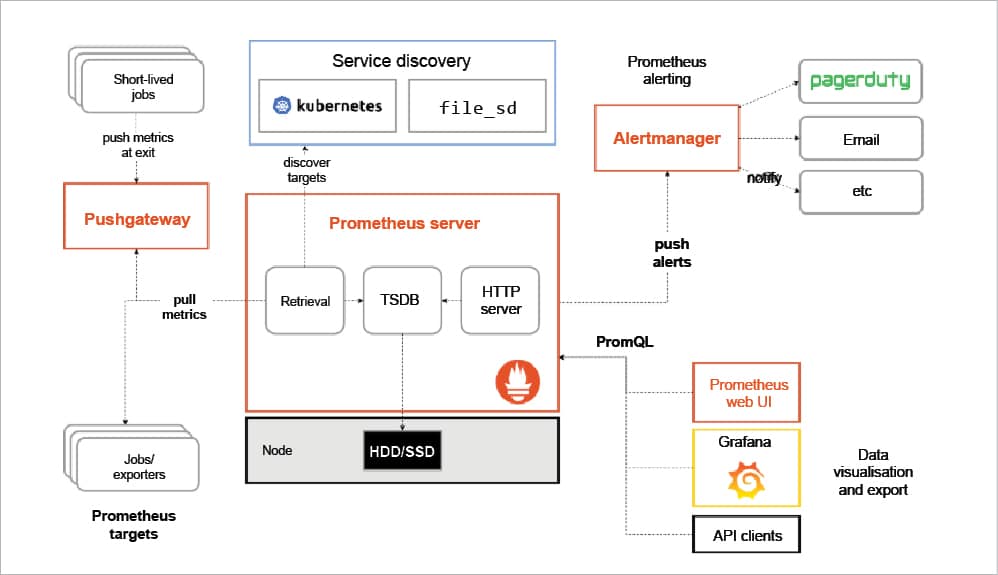
The heart of Prometheus is its server component, which has a collector that pulls the data from different data sources to store it in an inbuilt time series database (TSDB). It also has an API server (HTTP server) to serve the API request/response.
The unique feature of Prometheus is that it is designed for pulling out data to make it scalable. So, in general, one need not install an agent to the various components to monitor them. However, Prometheus also has an optional push mechanism called Pushgateway.
The Alert Manager is the component to configure the alerts and send notifications to various configured notifiers like email, etc. The PromQL is the query engine to support the query language. Typically, it is used with Graphana, although Prometheus has an intuitive inbuild Web GUI. Data can be exported as well as visualised. For the sake of brevity, we are only covering the Prometheus Web GUI, not the Graphana based visualisation.
So let us play around with Prometheus.
It is now time to get our hands dirty. A typical Prometheus installation involves the following best practices:
- Install kube-prometheus.
- Annotate the applications with Prometheus’s instrumentation.
- Label the applications for easy correlation.
- Configure the Alert Manager for receiving timely and precious alerts. Let us configure Prometheus in a demo-like minimalistic deployment to get a taste of it. To configure Prometheus.yml, use the following code:
global:

scrape_interval:     30s

evaluation_interval: 30s

scrape_configs:

- job_name: ‘prometheus’

static_configs:

 - targets: [‘127.0.0.1:9090’, ‘127.0.0.1:9100’]

labels:

group: ‘prometheus’
To start Prometheus, type:
docker run -d --net=host \

> -v /root/prometheus.yml:/etc/prometheus/prometheus.yml \

> --name prometheus-server \

>  prom/prometheus
For starting the node exporter, the code snippet is:
docker run -d \

>   -v “/proc:/host/proc” \

>   -v “/sys:/host/sys” \

>   -v “/:/rootfs” \

>   --net=”host” \

>   --name=prometheus \

>   quay.io/prometheus/node-exporter:v0.13.0 \

>     -collector.procfs /host/proc \>     -collector.sysfs /host/sys \

>     -collector.filesystem.ignored-mount-points “^/(sys|proc|dev|host|etc)($|/)”
| Note: The paths shown here are purely local to a demo deployment. You may have to adjust the paths as per your own deployment. |
- Raw metrices can be viewed by curl localhost:9100/metrices. In the URL, it can be viewed in /metrics endpoint.
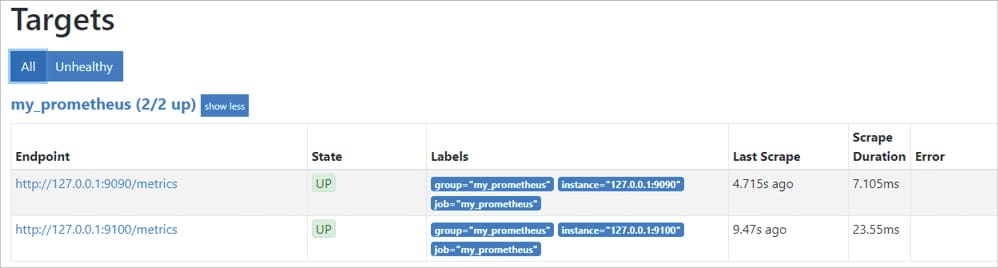
- The metrics view can be found in /targets URL. For production, Graphana is the preferred tool.
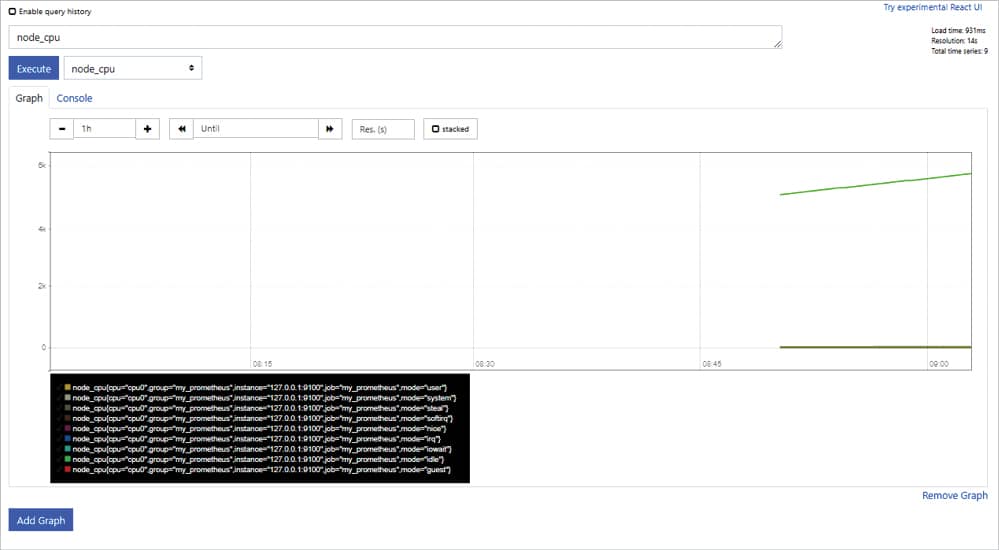
- The graph view can be found in /graph URL. Any metrics collected (viewable using /metric endpoint) can be viewed in /graph.
Sensu: Complementing Prometheus
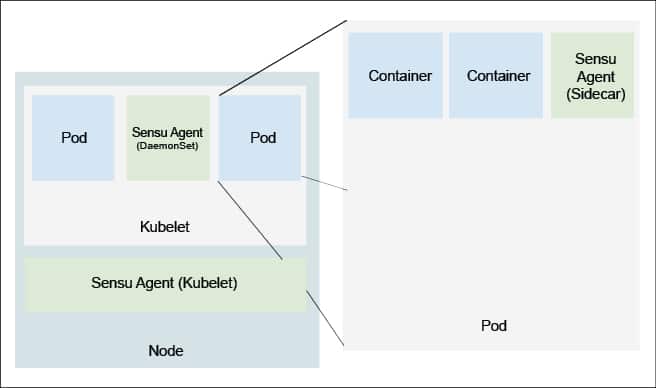
Prometheus has lots of advantages because of its scalability, pluggability and resilience. It is tightly integrated with Kubernetes and has a thriving supportive community. However, it has a few disadvantages also. For example, the simplified constrained data model loses various contexts of the measurements. It is tightly integrated with Kubernetes, so if the deployment is multi-generational, it may face challenges. The data transported is neither authenticated nor encrypted. Sensu complements Prometheus on this aspect aptly. Figure 4 shows how Sensu agents are typically deployed in a Kubernetes environment.
Some of the advantages Sensu provides to complement Prometheus are as follows:
- Adds more context to Prometheus collected data to make it more meaningful.
- Workflow automation of remediation actions based on alerts. So, alerts become actionable. This is of paramount interest for self-healing purposes.
- Secure transport: Prometheus does not encrypt or authenticate the metrics.
In this article, we discussed how microservices based architectural patterns are getting contextual in a DevOps environment with the ubiquitous usage of Kubernetes. Monitoring of such a sizable deployment becomes challenging because of its highly dynamic nature. So, we need tools like Prometheus to overcome some of the monitoring challenges. Sensu acts as a complementary tool to Prometheus, improving the latter’s performance considerably.


