


Due to its many advantages and conveniences, cloud computing has become the norm rather than the exception for enterprises. In such a scenario, the security and monitoring of cloud services becomes extremely important. This article looks at how to secure Infrastructure as a Service (IaaS).
Before getting into the security aspects of IaaS, let’s first understand what it is all about and why securing it is more important than protecting other such services like PaaS and SaaS.
Infrastructure as a Service is the base for Platform as a Service (PaaS) and Software as a Service (SaaS), as these services are built on top of IaaS. Visualise IaaS as being the basement of a building, which is why it is very important to build a secure IaaS service to provide secured PaaS and SaaS services. In general, IaaS consists of compute, storage and network infrastructure, which you can quickly scale up and down, based on demand. As part of IaaS, most vendors provide virtual machines, storage, serverless computing and containers.
IaaS security challenges and solutions
Insider threats: Such threats are the biggest cyber security problem for organisations nowadays. They are harder to detect and prevent in comparison to attacks from the outside. Insiders know where the sensitive company and customer data is, and they have access to it. That means insiders know exactly where to strike if they decide to take action. This is why insider attacks have a much bigger negative impact on business.
Orphan disks and images: These are storage disks that are not attached to any computing servers. Improper handling of these disks can lead to leakage of sensitive data to the outside world. Even the misuse of these disks can go unnoticed for a long time. Unused machine images and object storage may have sensitive data, which should be deleted or moved to archival storage with proper access controls.
Account management gets compromised: Account management includes provisioning new users, managing user credentials, maintaining required access privileges, defining roles and the right set of policies. These processes are critical when it comes to the ‘privileged account’ credentials that grant certain users administrator/power levels of access.
Platform challenges: The hardware must be kept up to date to avoid security breaches. Refreshing hardware in a timely manner with minimal impact is a key challenge, particularly since the new/updated hardware version may come with new security challenges as well.
Operational challenges: Continuous monitoring across the platform becomes harder with the increase in the number of resources and size of logs. This makes security monitoring complex and expensive. Security analytics from countless logs becomes a challenging task, even though we may have hundreds of tools, as the attackers find new approaches and methods every now and then.
Endpoint security: The importance of endpoint security has increased as users are connecting from multiple devices like laptops, desktops, mobiles and PDAs (personal digital assistants). Each device connecting to the organisation’s network creates a potential entry point for security threats. Hackers typically use vulnerable endpoints as entries into the organisation’s network, to create a big impact.
Network security: There is a need to recognise and authorise each user and each device that connects with the organisation’s network. Non-compliant endpoint devices have to be blocked or given only limited access. Proper firewall rules will save you from more attacks by creating a barrier between internal and outer networks.
Physical security: Physical security is the protection of personnel, hardware, software, networks and data from physical actions and events that could cause serious loss or damage to an enterprise, agency or institution. This includes protection from fire, floods, natural disasters, burglary, theft, vandalism and terrorism.
Communication encryption: This is very essential for securing data in transit to avoid sensitive data from being intercepted. The value of encryption extends beyond safety, as many organisations are obligated to encrypt sensitive information, with penalties for the damages resulting from regulatory non-compliance.
Interface/API hacking: Interface hacking exposes resources to the world and makes them vulnerable to attackers. Often the attacker will try multiple spoofing methods to break API level security to get in, adding more challenges that need to be addressed. The major risk of APIs is that they often expose the underlying details of the application’s implementation, along with insights into other internal objects. This is valuable data that arms hackers to penetrate even further.
Open source tools for IaaS security
Let us look at some popular open source tools that secure IaaS implementations.
Nmap
Nmap (Network Mapper) is a free and open source (licence) utility for network discovery and security auditing. Its NSE scripts can detect vulnerabilities, misconfiguration and security related information around network services. Nmap uses raw IP packets in novel ways to detect the available hosts on the network, the running services, the version (application), operating systems and their versions, the type of packet filters/firewalls in use, etc.
As Nmap has grown in functionality over the years, it has become an important port scanner and this remains its core function. The simple command Nmap <target> scans 1,000 TCP ports on the host <target>. While many port scanners have traditionally lumped all ports into the open or closed states, Nmap is much more granular. It divides ports into six states: open, closed, filtered, unfiltered, open|filtered or closed|filtered.
Listed below are a few examples of how Nmap can be used for daily routine tasks.
To scan all reserved TCP ports on the machine server1.abc.org in verbose mode, use the following code:
#nmap -v server1.abc.org
To TCP scan the 198.116 Class B address space and test whether the systems run SSH, DNS, POP3, or IMAP on their standard ports, or anything on port 4564, use the code given below:
#nmap -sV -p 22,53,110,143,4564 198.116.0-255.1-127
Nmap will do random scans of 100 Web servers (port 80) by using the command shown below:
#nmap -v -iR 100 -Pn -p 80
To scan 4096 IPs for any Web servers (without pinging them) and save the output in greppable and XML formats, use the following code:
#nmap -Pn -p80 -oX logs/pb-port80scan.xml -oG logs/pb-port80scan.gnmap 216.163.128.20/20

Snort
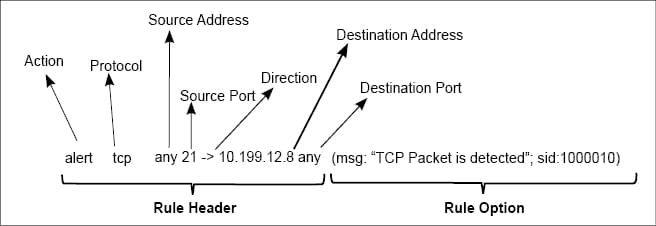
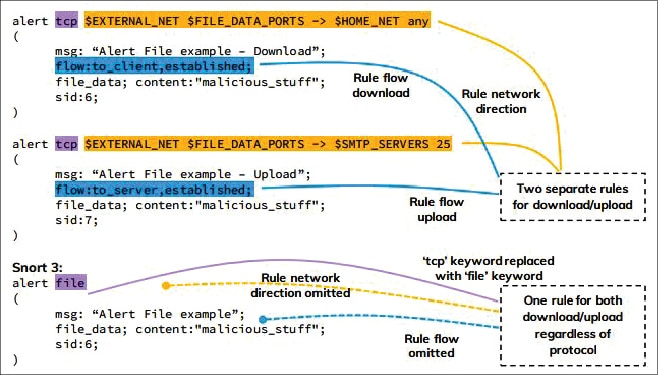
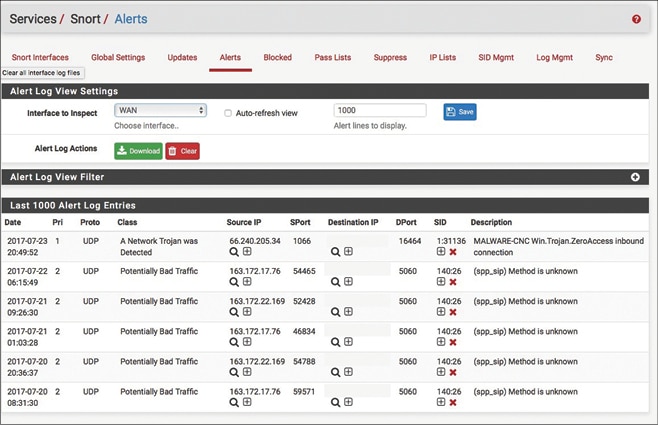
Snort is based on libcap (library packet capture) and is used for network intrusion detection and prevention, and in traffic analysis and packet logging on IP networks. Through protocol analysis, content searching and various pre-processors, Snort detects thousands of worms, vulnerability exploit attempts, port scans and other suspicious behaviour. Snort uses a flexible rule based language to describe traffic that it should collect or pass, and a modular detection engine. It can monitor the network traffic in real-time, scrutinising each packet closely to detect dangerous payloads or suspicious anomalies.
Snort supports the Centos, Debian, Fedora, FreeBSD, RHEL and Ubuntu platforms. To create a custom configuration, you need to update the following configurations, which can be done at snort.conf:
- Set the network variables
- Configure the decoder
- Configure the base detection engine
- Configure dynamic loaded libraries
- Configure pre-processors
- Configure output plugins
- Customise your rule set
- Customise preprocessor and decoder rule set
- Customise shared object rule set
Argus
Argus (audit record generation and usage system) is a real-time flow monitor that is designed to perform comprehensive data network traffic auditing. Argus is supplied as source code, so to really get started, you need to compile and install the software onto a ported system. Argus has been ported to all flavours of Linux and most UNIX and other OS that are available, including Solaris and Cygwin-enabled Windows systems.
Argus processes packet data and generates summary network flow data in real-time. If you have packets and want to know what’s going on, Argus is a great way of looking at aspects of the data that you can’t readily get from packet analysers. It answers questions like how many hosts are talking, who is talking to whom, how often, is one address sending all the traffic, are they doing bad things…etc. Argus is designed to generate network flow status information that can answer these and many more questions that you might have.
Many sites use Argus to generate audits from their live networks. Argus can run in an end-system, auditing all the network traffic that the host generates and receives. It can run as a standalone probe, running in promiscuous mode, auditing a packet stream that is being captured and transmitted to one of the systems network interfaces. This is how most universities and enterprises use Argus, monitoring a port mirrored stream of packets to audit all the traffic between the enterprise and the Internet.
The data is collected to another machine using radium() and is then stored in what we describe as an Argus archive, or a MySQL database. From there, the data is available for forensic analysis, or anything else you many want to do with it, such as performance analysis or operational network management.
Vault
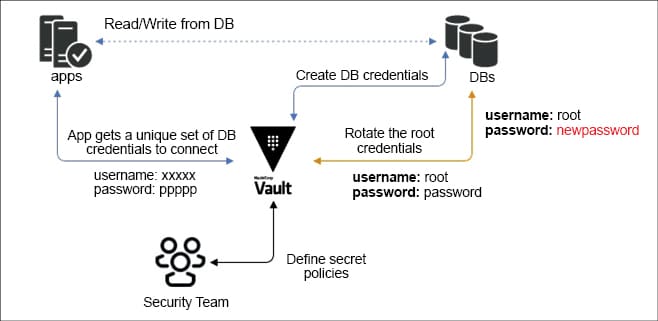
Vault by HashiCorp helps you secure, store and tightly control access to tokens, passwords, certificates and encryption keys to protect secrets and other sensitive data using a UI, CLI, or HTTP API. Vault supports most of the platforms available in the market, making it a key security tool.
It has three major areas of focus, as listed below.
Secret management:
- Dynamically create, revoke and rotate secrets programmatically.
- Encrypt data while at rest, in the storage backend.
- There are multiple pluggable identity backends.
- There is a detailed audit log of all client interaction.
- Users can manage authorisation and create time based tokens.
Data encryption:
- There is a centralised workflow to encrypt data in flight and at rest.
- AES 256-bit CBC data encryption and TLS in transit.
- Users can update and roll new keys throughout distributed infrastructure.
Identity based access:
- There are policy and access control decisions across platforms.
- Requires multiple identity entities to authorise a requested action.
- Centralised location to manage policies to authorise access across organisations.
- MFA workflows when accessing a secret or a secret path.
Open source tools for IaaS monitoring
At the very least, IaaS can be monitored via scripts and alerts can be triggered. But this comes with a lot of effort and complications as well. There are many open source tools available for IaaS monitoring and many licence based tools available for enterprise support. We will discuss only the open source tools available.
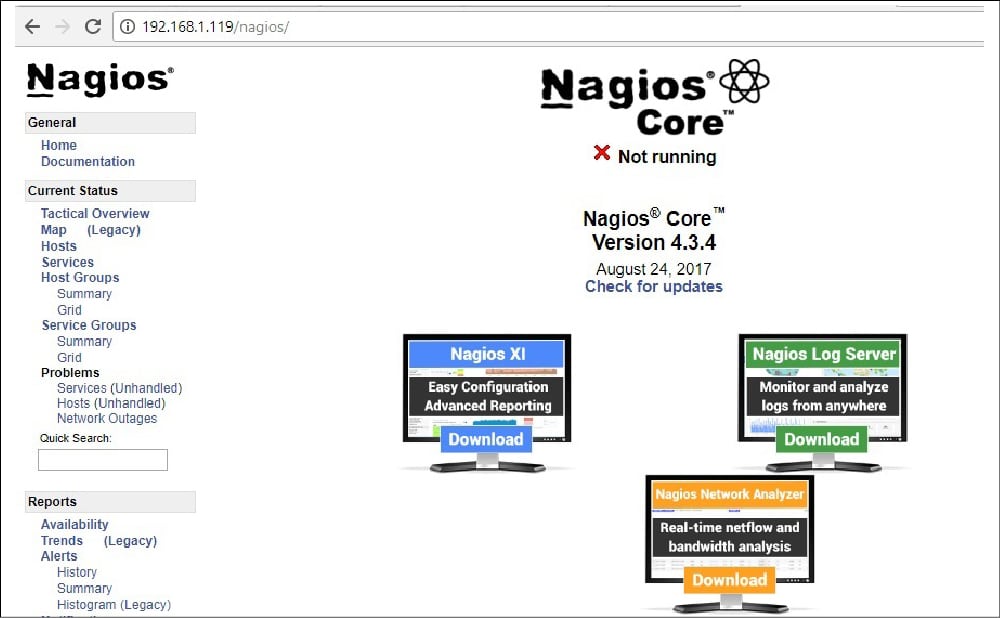
Nagios Core
Nagios Core is one of the open source monitoring and alerting tools used to monitor servers. It has a rich set of APIs to integrate with many tools and hypervisors, making Nagios a very powerful tool in the IT infra world.
Using Nagios, we can monitor servers, multiple operating systems, network traffic, network status, etc. It has agent based and agentless monitoring features. Nagios has a very strong community, which has contributed 5000+ add-ons, making it stronger than other tools.
- Using Nagios Core, you can monitor most of the IT infra resources and network services.
- There is the option to mute the alerts during scheduled maintenance.
- There is an option to send alerts via email/SMS or a predefined script.
- IT admins can acknowledge the alerts and they can be tracked.
- A powerful reporting dashboard provides historical events and alerts.
- Nagios Core provides a centralised dashboard for your entire IT operations, both on-premise and on the cloud.
- The capacity planning graphs help to proactively act on the infra upgrades.
- Multi-tenant capability provides good isolation across multiple clients or units.
- Ready-made plugins are available for public cloud vendors (like AWS, Azure, Google Cloud, Alibaba Cloud and Salesforce) to interact with the hypervisor.
The key benefits of Nagios are:
- Increased server and services availability
- Fast detection of network outages
- Fast detection of cloud computing environment problems
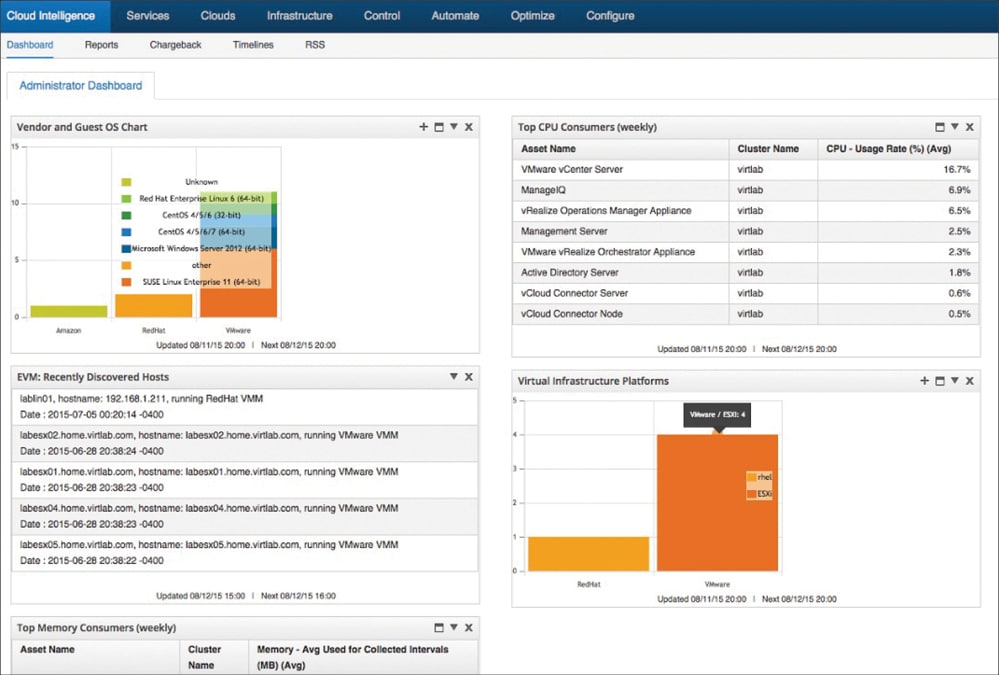
ManageIQ
ManageIQ is an open source platform for hybrid IT that helps to manage small and medium scale environments. It also has the capability to manage VMs, containers and public cloud resources. It has an agentless approach to collect the data. As it supports REST and SOAP interfaces, we can interact with any API supported application or tool. Refer to Figure 6 for a sample dashboard.
Its key benefits are:
- Continuously monitors the latest state of the resource
- Deploys a self-service UI for end users
- Maintains compliance across environments
- Optimises the usage of the environment
The best part of ManageIQ is that it is distributed as a fully installed virtual machine and comes with preconfigured CentOS 7.5, PostgreSQL 9.5, Rails 5, the ManageIQ application and all associated Ruby gems pre-installed. The appliance is available for VMware, Red Hat Enterprise Virtualisation and OpenStack. Appliances support horizontal scaling as well as dividing up work by roles. An appliance can be configured to handle work for one or many roles, with workers within the appliance carrying out the duties for which they are configured.
Multiple appliances can logically group into zones. The zones are configured to provide specific functionalities like UI Zone, Production Zone, etc. ManageIQ has the option to create zone affinity for a provider.
A region is a full installation of ManageIQ, containing one database appliance and potentially many other appliances. It is the collection of all zones that share the same database. In a typical enterprise installation, a separate region is used for each geographical region. For example, for an international corporation, one region may be placed in North America, a second in Europe and a third in Asia. When multiple regions are involved, we refer to the collection of all regions as the enterprise, like in Figure 7.
The point to note here is that only one appliance per region can provide the database. The ManageIQ appliance comes preconfigured with a default database. If a second appliance is added, it must be configured to point to the first appliance’s database.
Cloud Custodian
Cloud Custodian is another open source tool to monitor IT resources along with security and compliance. This tool is the right example of a script/rule based engine for monitoring cloud resources.
Cloud Custodian assists in good management in the cloud. The YAML DSL script allows you to define rules to enable a well-managed cloud infrastructure, which is both secure and cost optimised. It consolidates many of the ad hoc scripts that organisations have for lightweight and flexible tools, with unified metrics and reporting.
Cloud Custodian has a number of benefits:
- Maintains real-time compliance
- Governs cost management
- It’s use of readymade workflows, queries and policies makes life easy
- Can be run locally, on a remote VM or serverless
- Supports managing of most public cloud vendors like AWS, Azure and GCP
Cloud Custodian is a Python based application and supports Python 2 and 3 versions. You can run a two line command that will install Cloud custodian in minutes.
To install it on Windows, use the following code:
$ python3 -m venv custodian

$ ./custodian/Scripts/activate

(custodian) $ pip install c7n
==> Install AWS package

(custodian) $ pip install c7n_azure
==> Install Azure package

(custodian) $ pip install c7n_gcp
==> Install GCP Package
To install it on Linux server, give the following commands:
$ python3 -m venv custodian

$ source custodian/bin/activate

(custodian) $ pip install c7n
==> Install AWS package

(custodian) $ pip install c7n_azure
==> Install Azure package

(custodian) $ pip install c7n_gcp
==> Install GCP Package
Cloud Custodian is ideal to monitor well tagged resources only. If you are not managing tags well, you will be bottlenecked if you use Custodian. By default, Cloud Custodian generates CloudWatch metrics on each policy for the number of resources that match the tag key value, the time to retrieve and filter the resources, and the time to execute actions. Custodian uses the YAML format to keep its policies.
To get the metrics output, type:
$ custodian run -s <output directory> --metrics aws <policyfile>.yml
To send the metrics to a new name space in CloudWatch, give the following command:
$ custodian run -s <output_directory> --metrics aws://?namespace=foo
To send metrics to a specific region, use the following command:
$ custodian run -s <output_directory> --metrics aws://?region=ap-south-1
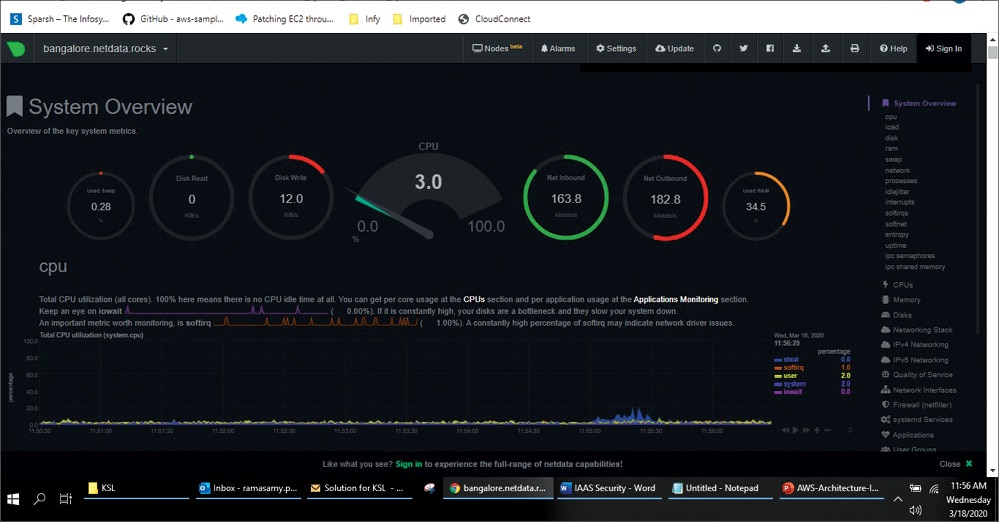
Netdata
This is another open source tool to monitor IT resources in real-time. Interactive visualisation is the advantage of using Netdata. It is an agent based tool that collects thousands of metrics from servers. Netdata has 100+ plugins pre-built to offer more suitable tools for monitoring multiple types of workloads.
Once the agents collect the data, the data/metrics are stored in a tiny internal database. After that, Netdata checks the health and triggers alarms if needed. Netdata can be easily integrated with other monitoring tools as well, if needed. The visual dashboard is optimised for visual anomaly detection, low latency and high resolution, which makes the tool very attractive. Refer to Figure 8 for the sample dashboard.
The GitHub repository for Netdata’ s open source monitoring agent is powered by nearly 300 contributors. You can use Netdata to monitor physical and virtual servers, containers, IoT/edge devices, Linux, FreeBSD, macOS, Kubernetes, Docker and all their derivatives.
The Netdata site provides an automatic one-line installation script for all Linux distributions, making your life easy during installation. The one line given below will install Netdata on your server. It’s magic, isn’t it?
bash <(curl -Ss https://my-netdata.io/kickstart.sh)
Apart from this, Netdata offers unique installation methods for the public cloud, Docker, Kubernetes, FreeBSD, MacOS, etc, along with manual installation. Netdata maintains two releases — Nightly and Stable. We recommend you to use Stable unless there is any requirement to use the Nightly version.
Netdata’ s internal database uses RAM to store recent metrics, ensuring dashboards and API queries are extremely responsive, while ‘spilling’ historical metrics to disk. This configuration keeps RAM usage low while allowing for long-term, on-disk metrics storage.
Netdata collects data automatically when you follow standard installation procedures. The key difference in using Netdata over other tools is that its internal plugins run within the Netdata dæmon, while external plugins are independent processes that send metrics to Netdata over pipes. There are also plugin orchestrators, which are external plugins with one or more data collection modules.
Its features include:
- Auto-detection of hundreds of metrics
- Real-time monitoring
- No time consuming configuration
- Good visual dashboard
- Hundreds of pre-built plugins
- Low-latency visualisations to detect anomalies
- Lightweight database


