


Binary exploitation works on the principle of turning a weakness into an advantage. In this article, the author deals with the basics of binary exploitation.
Binary exploitation involves taking advantage of a bug or vulnerability in order to cause unintended or unanticipated behaviour in the problem.
Basics required for binary exploitation
Binary exploitation might appear to be a strange topic but once you get started on it, you wont be able to stop. To get started, you need to know how the process memory is organised and how the stack is framed.
Processes are mainly divided into three regions: the text region, data region, and stack region.
The text region contains the data of the program and the executable file. You can only read the data and if you to try to write the data, it will throw up a segment violation.
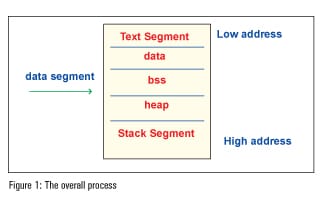
For easy understanding, the data segment is divided into three segments: data, BSS and heap. The data region contains global and static variables used in the program. The segment is further classified into two areasfor read-only data and the read-write area. The BSS segment has (uninitialised data) all global variables and static variables that are initialised to zero. Heap is usually managed by malloc, free, realloc, etc, where dynamic memory allocation is done
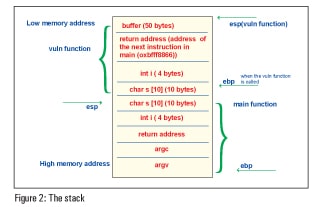
Stack is a type of abstract data type and it is LIFO (Last In First Out). It has a continuous block of memory containing data. The entire operations of the stack are controlled by the kernel. It is a continuous block of memory containing data in which the bottom of the memory is fixed (higher memory address). Mainly, there are two operations in the collection of data, which are push and pop. The addition of an entity to the stack is a push and the subtraction of an entity is a pop. The register pointing to the top of the stack is the stack pointer (SP), which changes automatically based on the operation, and the register pointing to the bottom of the stack is the base pointer (BP). With the help of a small code snippet, we can see how the stack is framed.
#include<stdio.h>
int add(int , int);
int main(int argc , char **argv)
{
int i;
int j;
int sum;
sum= add(i,j);
printf(Sum of two numbers = %d,sum); //assume that the address is 0xbfff8866
return 0;
}
int add(int i , int j)
{
int sum;
sum=i+j;
return sum;
}
Figure 2 depicts how the stack is framed for the above problem.
The GNU debugger
Most of you might be familiar with the printf debugger, which can only be used if you have the source code. But for the GNU debugger, you just need the executable file to see what is happening insidethe program.
Here is a list of commands that are frequently used in gdb.
1>prompt > gdb.
This is to get started with gdb.
2> (gdb) file executable filename
This gives the executable file name, which you need to debug.
3> (gdb) run
is to run the program in gdb.
4> (gdb) kill
is used to kill the program being debugged.
5> (gdb)disass function name\
disassembles the function into the assembler.
6> (gdb)b (line number) or (function name) or *(address)
…sets break points at certain points of the code.
It is very important to learn how to do this last bit because while doing exploitations, you need to set break points and analyse how the program behaves.
7> (gdb) x/o(octal) or x(hex) or d(decimal) or u(unsigned decimal) or t(binary) or f(float) or a(address) or i(instruction) or c(char) and s(string) (string name) or $(register name)
This is used to examine the memory of the code.
Lets take a look at an example.
x/1s s gives you what is in string s.
8> (gdb)info files or breakpoints or registers.
…will print the list of break points, files or registers.
9> (gdb)help command
With the command name and help argument, gdb displays a short paragraph on how to use that command.
A buffer overflow
A buffer overflow happens when a program tries to store more data than the actual size of the buffer. In such a case, the data overflows from the buffer, which leads to overwriting of the adjacent memory fragments of the process, as well as overwriting of the values of the IP (Instruction Pointer) or BP (Base Pointer) or other registers. This causes exceptions and segmentation faults, leading to other errors.
The problem given in the code snippet below will give you an idea about buffer overflows.
#include<stdio.h>
int main()
{
char buffer[50];
buffer[60]=a;
return 0;
}
When you compile the above problem, the compiler will not throw you an error because there is no automatic bound checking on the buffer. But when you try to see the output of the program, it throws up a segmentation fault.
In buffer overflow attacks, the hacker tries to take advantage of extra memory segments for other operation instruction sets to inject malicious arbitrary code such as shell codes, and the pre-determined program behaviour is changed eventually. To exploit buffer overflows, you need to have some idea of assembly code instructions and you should get control over the eip register. Getting control over eip is very simpleyou just need to know how the stack is framed and know where the eip register is located. Getting control of gdb also helps you to find the eip register. Once you get control over eip you can return to any point in the code and get arbitrary things like the shell.
A buffer overflow also occurs due to some vulnerabilities in the problem. Normally, buffer overflow vulnerabilities are found through source code analysis, or by reverse engineering application binaries.
With the help of this small problem, let us look at how a buffer overflow could possibly occur.
#include<stdio.h>
#include<string.h>
void function(char *string)
{
char buffer[50];
strcpy(buffer,string);
}
int main(int argc, char **argv)
{
function(argv[1]);
return 0;
}
Figure 3 clearly describes the above problem.
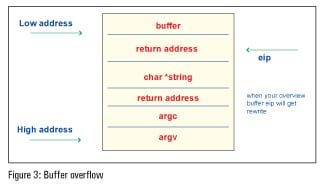
In the above problem, if the input is less than 50 characters, then the program will execute normally. When 50 characters are exceeded, the compiler throws up a segmentation fault. The above problem describes how the vulnerability strcpy leads to an overflow.
To get started up with buffer overflows, it would be good if you start up with picoctf. Once you are familiar with it, you can smash the stack.
Shell code
In most of the binary exploitation problems, we just have to capture the shell, so we need to know a little bit about how to write shell code. As of now, we can modify the return address (which is just the address of eip) by just overflowing the buffer. In most cases, you just need to spawn the shell. From the shell, you can execute the command as you like. With the help of this small code snippet in C, you will get the shell.
#include<stdio.h>
int main()
{
system(/bin/sh);
}
When you compile the above code in a terminal, you will get a shell. Writing the code in C language is simple, but when you need to inject it in a buffer, it should be in ASCII as you cannot inject the code in C into the buffer. It is not that necessary to learn to write shell code in ASCII because of online availability. The online resource for shell code is http://shell-storm.org/shellcode/


