Monitoring multiple data centres is becoming a daunting task for sysadmins, and it certainly starts to become tiresome as the number of nodes increase rapidly. System administrators would typically want to check systems statistics like the disk, CPU and network utilisation, etc. They would be interested in knowing whether systems are performing within thresholds, where the bottlenecks are occurring, and how applications are performing. Now, when managing a few systems, you could probably log in to each system and check — but, as mentioned earlier, it becomes a problem as infrastructure grows.
So, you need a performance monitoring system to solve your problem — one that does not overload you with a lot of unwanted statistics, but only those that actually help you identify problems. With these conditions in mind, Ganglia is surely an option to explore. The good thing is that once you have it running, you can customise it to a great extent, writing your own custom metrics.
Ganglia is an open source project, originally designed by the University of California. It acts as a distributed monitoring system for high-performance systems like clusters and grids. For a more formal definition (from ganglia.info: “Ganglia is a scalable distributed monitoring system for high-performance computing systems such as clusters and grids. It is based on a hierarchical design, targeted at federations of clusters. It leverages widely used technologies such as XML for data representation, XDR for compact, portable data transport, and RRDtool for data storage and visualisation.”
Here is a small glossary of terms used in Ganglia:
- Host/node: Typically, a machine.
- Cluster: A group of nodes.
- Grid: A group of clusters.
- Metrics: The graphs that are displayed.
- RRDs or Round Robin Databases: According to its website, RRDtool (the Round Robin Database tool) is a system to store and display time-series data (e.g., network bandwidth, machine-room temperature, server load average, etc). It stores the data very compactly to maintain a manageable archive size. RRDtool presents useful graphs (see Figure 1) by processing the data to enforce a certain data density.

Ganglia architecture
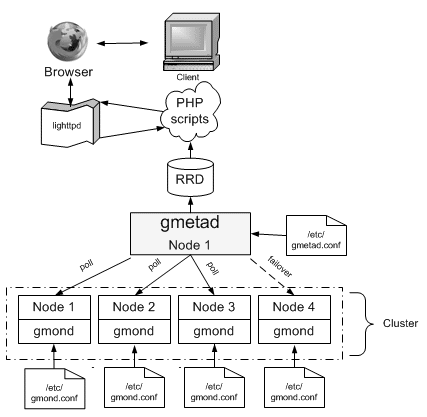
The Ganglia architecture (see Figure 2) has the following main components:
- Ganglia monitoring daemon (gmond)
- Ganglia meta daemon (gmetad)
- RRD
- Ganglia frontend
Ganglia monitoring daemon
gmond is installed on all nodes that need to be monitored. It monitors the changes in host state, listens to other gmond instances over multi-cast/unicast, and is responsible for sending XML, over a TCP connection, to gmetad. To get started, you need to edit the cluster information in the configuration file. Given below is a sample of a gmond.conf configuration file to get started with:
/*
 * The cluster attributes specified will be used as part of the <CLUSTER>
 * tag that will wrap all hosts collected by this instance.
 */
cluster {
  name = "mymachine"
  owner = "Konark"
  latlong = "unspecified"
  url = "unspecified"
}
Ganglia meta daemon
gmetad collects information from multiple gmond or gmetad sources. It saves the information to a local round-robin database, and exports (in XML) a concatenation of all the data sources. Below is a sample configuration:
data_source "cluster name" [polling interval] address1:port addreses2:port ...
The keyword data_source must immediately be followed by a unique string that identifies the source, and then by an optional polling interval in seconds. The source will be polled at this interval, on an average. If the polling interval is omitted, 15 seconds is assumed. A list of machines that service the data source follows, in the format ip:port, or name:port. If a port is not specified, 8649, the default gmond port, is assumed. In my case, when monitoring my local system, it is:
data_source "mymachine" 127.0.0.1
RRD
As defined earlier, RRDs are Round-Robin Databases. The data is archived after each hourit is stored in an average form. You can demand the exact value of a particular instance of a particular month and hour. The defaults for RRDs are:
RRA:AVERAGE:0.5:1:244
RRA:AVERAGE:0.5:24:244
RRA:AVERAGE:0.5:168:244
RRA:AVERAGE:0.5:672:244
RRA:AVERAGE:0.5:5760:374
Ganglia PHP Web frontend
The frontend presents the data collected by gmond and gmetad in a meaningful form. Ganglia has been around for many years without much change to the UI — but since October 2010, a few contributors began contributing to a new UI, which looks awesome (see Figure 3).

Let’s briefly look at the six different options (tabs):
- Main: This shows the summarised form of how the grid and each cluster are behaving. You can then select individual clusters from the drop-down menu, to view how the various nodes under it are performing.
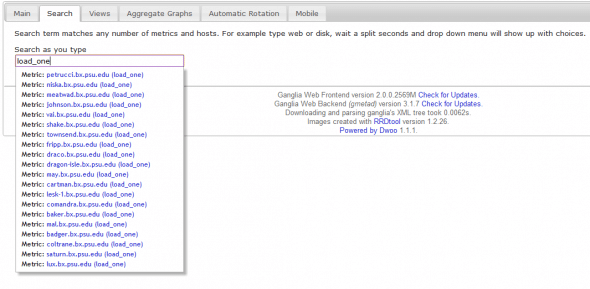
- Search:This awesome new feature wasn’t available in the previous interface. It lets you search for metrics or hosts (see Figure 4). It will show results as you type; clicking on the selected result will take you to a new window.
- Views:At times, you need to see a different set of metrics from different sources on a single page. To achieve this, use views (see Figure 5), which are nothing but JSON files; each view has one JSON file, with a configuration like the following, which would show cpu_report and apache_report from both hosts:
{"view_name":"default",
   "items":[
      {"hostname":"host1.bx.ps.edu","graph":"cpu_report"},
      {"hostname":"host2.bx.ps.edu","graph":"apache_report"}
    ],
    "view_type":"standard"
}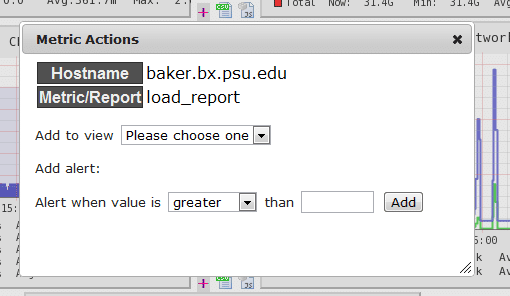
Figure 5: Views Another cool aspect about this is that you don’t need to write code for it; you could simply do this via the GUI, by clicking the (+) option on the top right corner and selecting the view that you want added in this metric.
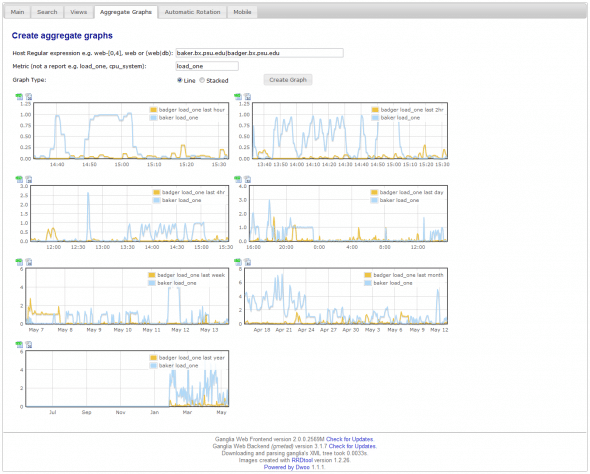
- Aggregate graphs:This option lets you aggregate two or more hosts over a common metric — very useful to look for bottlenecks in your infrastructure. Graphs can be of the line or stacked variety (see Figure 6).
- Automatic rotation: This lets you set your views to automatic rotation; you can view different metrics in a view, one by one, like slides — very useful for continuous monitoring over dashboards. Also, you can open multiple views simultaneously on different browsers, and set the rotation time in seconds.
- Mobile views: This lets you monitor your infrastructure over the mobile. It looks pretty neat and clean on the mobile screen.
- Time range: You can view performance for the last two hours, four hours, the last day, week, month, year or any custom time range you define.
Custom metrics
Ganglia comes in with a lot of metrics, by default, like various CPU, network I/O and memory metrics. But there is certainly a need to trend and monitor a lot more data, like Apache statistics, Memcache evictions, Java performance, and to track the effect of releases on servers, users, etc. This can be done by writing your own modules that run with gmond, or use the command gmetric that comes with the Ganglia set-up. Both have their own advantages and use cases.
These are just a few points. What makes Ganglia so attractive is how easy it is to trend your data. Once you have your setup up and running, you will really like the way it works. And this is not the end; its integration with Nagios is really going to help, because then you have the power to set alerts on trending data.


