 A site is only as fast as its last mile connectivity. If users access a site from a slow connection, even a site capable of responding quickly to requests will appear to be slow. A content management system like Drupal throws in additional challenges to the Web architect in improving performance because, typically, the Apache process takes up more space than a site serving traditional HTML or PHP pages. Read on to take a look at the various external factors that impact performance, and explore ways to mitigate them.
If customers complain of lengthy page load times, browsers displaying white pages, and 408 Request Timeout errors, then these are tell tale signs indicating that your site infrastructure is unable to cope up with the traffic, usually resulting in the server taking a long time to respond to a request or sometimes not returning the requested pages.
Drupal site performance bottlenecks: Where does the time go?
The first step is to identify the bottlenecks between the time a page was requested for from the browser till the time it is completely loaded, to determine the causes of delay.
There are several components between the browser and the Web server that could contribute to the delay – some of these can be fine tuned by you, as the architect, while for the others that are not managed by you, alternative solutions will have to be found. Let’s start with a component that is not managed by you.
Network latency
Latency is caused by the underwater cables laid along the seabed and other telecom hardware. These infrastructure components contribute significantly to performance degradation. So investigations should ideally start from the client side by measuring the latency of the Internet connection. You can do this from a terminal or command line by running traceroute to check potential bottlenecks. Here is what it looks like for one of our Rackspace servers hosted out of Texas in US.
With such high network latencies, it’s obvious that users experience very lengthy page download periods. The quickest and probably the only way to resolve this is to ask the site visitor to access it from a faster network connection. The average latencies for servers located across the Pacific range from 300ms to 400ms. If further reduction is needed, consider moving the site from the US to a server hosted out of India, where the average latency is about 30 to 40ms. Once you are comfortable with the network latency, it’s time to check for other extraneous factors affecting response speed.
Are crawlers and bots consuming too many resources?
Another rather painful behind-the-scenes cause for latency is the work of bots, crawlers, spiders and other digital creatures. More often, crawlers and bots can creep into your site unnoticed, and though not all of them do so with a malicious intent, they can consume valuable resources and slow down the response times for users. In some of the corporate sites that we built, we found the Google bot had indexed the site even before we mapped it to a URL! There are several ways to ensure that bots don’t get overly aggressive with their indexing process by specifying directives in the robots.txt file. These directives tell these creatures where not to go on your site, thus making bandwidth and resources available to human visitors.
You can specify a crawl delay with the Crawl-delay directive. So a statement like the one below will tell the bot to wait for 10 minutes between each crawl.
Crawl-delay: 10
You can limit the directories crawled by disallowing directories that you do not want displayed in search results using the Disallow directive. For example, the statement below tells the crawler not to index the CHANGELOG.txt file, and you can specify entire directories if you wish.
Disallow: /CHANGELOG.txt
However, these instructions come with a caveat – compliance with these directives is left entirely to the authors of the spider or bot. Don’t be surprised if they don’t seem to be respecting these directives (though all the major ones do), in which case, frankly, there is nothing much to be done about it! To be effective, the robots.txt should be well written. A tool to check the syntax of the robots.txt file is available at http://www.sxw.org.uk/computing/robots/check.html. Run the robots.txt through this to check if it’s properly written.
Some search engines provide tools to control the behaviour of their bots. Often, the solution to an over-aggressive Google bot is to go into Google Webmaster and reduce the crawl rate for the site, so that the bot is not hitting and indexing too many pages at the same time. Start with 20 per cent, and you can go up to 40 per cent in severe cases. This should free up resources so that the server serves real users.
Apache Bench
The HTTP server benchmarking tool gives you an insight into the performance of the Apache server. It specifically shows how many requests per second the server is capable of serving. You can use AB to simulate concurrent connections and determine if your site holds up. Install Apache Bench on your Ubuntu laptop using your package manager and fire the following command from the terminal:
ab -kc 10 -t30
ab -kc 10 -t30
/
The above command (the trailing slash is required) tells Apache Bench to make 10,000 connections, use the HTTP keep alive feature of Apache, and wait for a maximum of 30 seconds for a response from the server. The output contains various figures, but the one you should look for is the following line:
Requests per second: 0.26 [#/sec] (mean)
Check memory usage
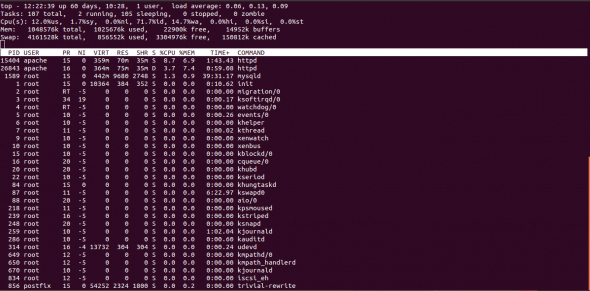
Though Apache is bandwidth limited, the single biggest hardware issue affecting it is RAM. A Web server should never have to swap, as swapping increases latency. The Apache process size for Drupal is usually larger compared to ground-up PHP sites, and as the number of modules increases, the memory consumption also increases. Use the top command to check the memory usage on the server and free up RAM for Apache. Figure 2 shows a screenshot from one of our servers.
Look for unnecessary OS processes that are running and consuming memory. From the listing, right at the bottom, you can see that postfix is running. Postfix is a mail server that was installed as part of the distribution and is not required to be on the same server as the site. You can move services like this to a separate server and free up resources for the site.
Use the Drupal modules that inhibit performance, selectively
Use ps -aux | sort -u and netstat -anp | sort -u to check the processes and their resource consumption. If you find that the Apache process size is unduly high, the first step is to disable unnecessary modules on the production servers to free memory. Modules like Devel are required only in your development environment and can be removed altogether. After you have disabled unnecessary processes and removed unnecessary modules, run the top command again to check if the changes you have made have taken effect.
Reduce Apaches memory footprint
The Web server is installed as part of your distribution and can contain modules that you might not require, for example, Perl, etc. Disable modules that are not required. On Ubuntu, you can disable an Apache module using a2dismod while on Centos machines, youll have to rename the appropriate configuration file in /etc/httpd/conf.d/. On Centos, some modules are loaded by directives in /etc/httpd/conf/httpd.conf. Comment out the modules (look for the LoadModule directive) that you dont need. This will reduce the memory footprint considerably. On some of our installations, we disable status and mod-cgi because we dont need the server status page, and we run PHP as an Apache module and not as CGI.
Configure Apache for optimum performance
Another raging debate is on whether to use Worker or Prefork. Our Apache server uses the non-threaded MPM Prefork instead of the threaded Worker. Prefork is the default setting and we have left it at that. We havent had issues with this default configuration and hence aren’t motivated enough to try Worker. You can check what you are running using the following commands:
/usr/sbin/httpd -l (for Centos) and /usr/sbin/apache2 -l (for Ubuntu).
Set the HostnamesLookups to Off to prevent Apache from performing a DNS lookup each time it receives a request. The downside is that the Apache log files will have the IP address instead of the domain name against each request.
AllowOverride None prevents Apache from looking for .htaccess in each directory that it visits. For example, if the directive was set to AllowOverride All then if you were to request for http://www.mydomain.com/member/address, Apache will attempt to open a .htaccess file in /.htaccess, /var/.htaccess, and /var/www/.htaccess. These lookups add to the latency. Setting the directive to None improves performance because these lookups are not performed.
Set Options FollowSymLinks and not Options SymLinksIfOwnerMatch. The former directive will follow symbolic links in this directory. In case of the latter, symbolic links are followed only if the ownership of the link and the target match. To determine the ownership, Apache has to issue additional system calls. These additional calls add to the latency.
Avoid content negotiation altogether. Do not set Options Multiviews. If this is set and if the Apache server receives a request for a file that does not exist, it looks for files that closely match the requested file. It then chooses the best match from the available list and returns the document. This is rather unnecessary in most situations. Its better to trigger a 404.
In addition to this, you will need to set the following parameters in the httpd.conf (Centos) / apache.conf (Ubuntu) file depending on the distribution you are using.
MaxClients: This is the maximum concurrent requests that are supported by Apache. Setting this to Too low will cause requests to queue up and eventually time-out, while server resources are left under utilised. Setting this to Very high could cause your server to swap heavily and the response time degrades drastically. To calculate the MaxClients, take the maximum memory allocated to Apache and divide it by the maximum child process size. The child process size for a Drupal installation is anywhere between 30 to 40 MB compared to a ground-up PHP site, which is about 15 MB. The size might be different on your server depending on the number of modules. Use
ps -ylC httpd sort:rss (on Centos) or ps -ylC apache2 -sort:rss (on Ubuntu)
to figure out the non-swapped physical memory usage by Apache (in KB). On our servers, with 2 GB of RAM, the MaxClients value is (2 x 1024) / 40, i.e., 51. Apache has a default setting of 256 and you might want to revise it downward because the entire 2 GB is not allocated to Apache.
MinSpareServers, MaxSpareServers and StartServers: The MinSpareServers and MaxSpareServers determine how many child processes to keep active while Apache is waiting for requests. Set the MinSpareServers very low and a bunch of requests will come in; Apache has to spawn additional child processes to serve these requests. Creating child processes takes time and if Apache is busy creating these processes, the client requests wont be served immediately. If the MaxSpareServers is set too high then unnecessary resources are consumed while Apache listens for requests. Set MinSpareServers to 5 and MaxSpareServers to 20.
StartServers specifies the number of child server processes that are created on start-up. On start-up, Apache will continue to create child processes till the MinSpareServers limit is reached. This doesn’t have an effect on performance when the Apache server is running. However, if you restart Apache frequently (seldom would anyone do so) and there are a lot of requests to be serviced, then set this to a relatively high value.
MaxRequestsPerChild: The MaxRequestsPerChild directive sets the limit on the number of requests that an individual child server process will handle before it dies. By default, it is set to 0. Set this to a finite valueusually a few thousands. Our servers have it set to 4000. It helps prevent memory leakage.
KeepAlive: KeepAlive allows multiple requests to be sent over the same TCP connection. Turn this on if you have a site with a lot of imagesotherwise for each image a separate TCP connection is established and establishing a new connection has its overheads, adding to the delay.
KeepAliveTimeOut: This specifies how long Apache has to wait for the next request before timing out the connection. Set this to 2 – 5 seconds. Setting this to a high value could tie up connections that wait for requests when they can be used to serve new clients.
Disable Logging in access.log. If you would like to go to the extremes, you can disable Apache from logging each request it receives by commenting the CustomLog directive in httpd.conf.
A similar directive is likely to be in your vhost configuration so ensure that you comment it out. I wouldn’t recommend it though, because access logs are used to provide an insight into visitor behaviour. Instead, install log rotate.
On Ubuntu, use:
sudo apt-get install logrotate
On Centos, however, log rotate is run daily via the file /etc/cron.daily/logrotate. The configuration files for it are available in /etc/logrotate.conf and /etc/logrotate.d
Increase the Apache buffer size. For very high latency networks, especially transcontinental connections, you can set the TCP buffer size in Apache with the directive SendBufferSize bytes.


