Considered one of the most versatile of benchmarks, Vdbench can be used as a GUI tool or a CLI tool. It is highly portable and works on different platforms like Windows, Solaris, Linux, AIX, OS/X and HP/UX.
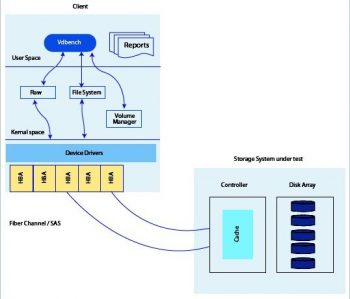
Vdbench is a controlled I/O load simulation tool for storage systems. It gives control over workload parameters like I/O rate, LUN or file size, transfer size and cache hit percentage. It generates reports which are Web accessible in HTML format. It is an open source tool from Oracle, with 99 per cent of it written in Java and 1 per cent in C language. It works on all Linux and Windows operating systems. It is designed to execute workloads on a storage system.
In a simple equation, f(workload, Config) = Power + Performance. With a set of workloads defined through a configuration file, you can measure the performance of any storage array. It runs as two or more Java virtual machines. The one we invoke is the master, which takes care of parsing and reporting. The actual workload is executed by one or more slaves. A slave can run along with the master or in a different host. Vdbench can be useful for identifying data corruption on the storage system. A combination of data validation and journaling allows you to identify data corruption issues across executions. In short, it is a truly enterprise-grade storage benchmark that is free and open source.
Installation
Vdbench can be downloaded from the website
The vdbench50405.zip file contains the executables needed for Windows and Linux environments. Just extract the zip file and run ./vdbench -t (Raw workload) or ./vdbench tf (File system workload) to verify the installation. Results will be stored under output/summary.html.
Parameter definition
Vdbench has three basic definitions in the configuration file.
- SD or storage definition: This defines what storage to use for the testing.
- WD or workload definition: This defines the workload parameter for the testing.
- RD or run definition: This defines storage, workload and run duration.
Storage definition
SD defines the storage used for the testing. Make sure you select the right storage or else everything on the selected disk could get destroyed. The SD name should be unique.
sd=default,size=100g
sd=sd1,lun=/dev/sdb0
sd=sd2,lun=/dev/sdb1,size=100g
sd=sd3,lun=/dev/sdb2,size=200g

Workload definition
WD defines the workload used by the script for testing. The WD name must be unique.
WD parameters include the following:
- sd – Test device
- seekpct – Percentage time to move location
- rdpct – Read percentage
- xfersize – Transfer size
- skew – Percentage of skew this workload receives from the total I/O rate
- wd – Default setup for the workload
- threads – How many concurrent operations for this workload
- hotband – Executes hot band workload against a range of storage
wd=hotwd_uniform,skew=6,sd=sd*,seekpct=100,rdpct=50 wd=hotwd_hot1,sd=sd*,skew=28,seekpct=rand,hotband=(10,18)
Run definition
RD defines what storage and workload will be run together and for how long. Each run definition name must be unique.
RD parameters include:
- wd – Workload load definition
- iorate – Either IOPS, ‘max’ or ‘curve’
- warmup – Warm-up time that will be excluded from the elapsed time (10s/2m/1h)
- elapsed – How long to run
- interval – Stats collection interval
- threads – Number of threads
- forrdpct – Range of percentage read to execute
rd=rd1_hband,wd=HOTwd*,iorate=MAX,warmup=30,elapsed=6H,interval=10,pause=30,th=200 rd=rd1_seq,wd=wd_seq,iorate=max,forrdpct=(0,100),xfer=256K,warmup=30,el=20m,in=5,th=20
Here is a sample configuration file.
// SD: Storage Definition
// WD: Workload Definition
// RD: Run Definition

sd=sd1,lun=/dev/sdb0
wd=rr,sd=sd1,xfersize=4096,rdpct=100
rd=run1,wd=rr,iorate=100,elapsed=10,interval=1

// Single raw disk, 100% random read of 4k records at i/o rate * of 100 for 10 seconds
To run the Vdbench, type the following commands:
/vdbench/vdbench -f conf1.txt conf2.txt -o output+
/vdbench/vdbench -i 10 -f simple_test.conf -o simple_test+
Parameters include:
- -f – Configuration file(s)
- -o – Output directory
- -e – Elapsed time override
- -i – Interval time to override
- -w – Warm-up time to override
- -j – Activates data validation and journaling
Utility functions
- ./vdbench sds – This is used to generate SD params.
- ./vdbench dvpost – This is used to analyse data corruption issues.
- ./vdbench rsh – This is to start Vdbench slaves on the host and return stdout and stderr.
- ./vdbench compare – Compares two sets of Vdbench output directories.
Reports
On completing a successful test run, Vdbench creates the following HTML files.
Summary.html – Reports the total workload generated for each interval.
Totals.hml – Reports only the total without detailed interval information.
Logfile.html –Reports Vdbench logging information for debugging.
Kstat.html – kstat statistics (only on Solaris).
Histogram.html –Reports distribution of response times for both reads and writes combined.
Flatfile.html – Performance data file, which can be used to generate performance charts.


