This article introduces users to the ELK stack. Apart from discussing how it helps in better data analytics, there are detailed explanations about the internal workings of Elasticsearch, as well as insights into how Logstash and Kibana complement Elasticsearch’s capabilities.
Big Data refers to large data sets that combine structured, semi-structured and non-structured data from various sources. Big Data is not just big in size but can also provide various insights about running and improving businesses when it is anlysed. It can give insights on user behavioural patterns, changing trends, a system’s health or any anomalies. The analysis helps improve customer integration, detect abnormalities and mitigate fraud.
Increased Internet penetration and a mobile in every hand are generating loads of user data for companies. This data is of high velocity, volume and variety. A lot of data is being generated from mobiles, media devices, traffic surveillance systems, messages, etc. This data needs to be analysed in real-time to provide the user with consumable insights.


Imagine an e-commerce company that aims to provide high-quality customer service. When users search for a product on the website, they want the best-suited results to be shown. For a better user experience, various other factors like user age, brand, budget and location are added to the user search.
Relational databases have predefined schema to store structured data, whereas data being generated today can be non-structured. The real power of data can be harnessed only when we are able to aggregate the data collected from various sources. Data can be structured (has a defined schema) or unstructured (has no defined schema). Examples like user number, location and email can be stored in an SQL database as structured. User information, such as payment mode, wish lists and previous orders, is stored in an unstructured format. To provide the best user experience, users should be shown recommendations and search results based on an analysis of the data collected about them — for example, combining users’ product search with their purchase history and budget range. No matter how complex data is, it needs to be combined and analysed properly for the best decision making.

ELK is an acronym for three open source projects. The first is Elasticsearch, which is the distributed search and analytics engine. Then comes Logstash, which is the data pipeline that helps ingest data from multiple sources, transforms it and sends it to data stashes like Elasticsearch. And finally, Kibana lets users visualise data stored in Elasticsearch for better understanding and business interactions. ELK is easy to set up, scalable and efficient, and provides near real-time search analytics. Its capabilities include data feature enhancing, visual analytics and alerting mechanisms with the help of Logstash and Kibana.
A hands-on guide on the ELK stack can be found at github.com/Alakazam03/ELK-Tutorial.
1. Logstash
Logstash is a server-side data processing pipeline used to ingest, parse and then transform data, before outputting it to Elasticsearch. It provides various filters that enhance the insights and human readability.
Logstash ingests the structured and unstructured data from various sources such as logs, system metrics and Web applications, by using the input plugins available. It transforms and combines the data using many of the available filters to a common format for more powerful analysis and business value.
Filter examples
- grok: Derives structure from unstructured data
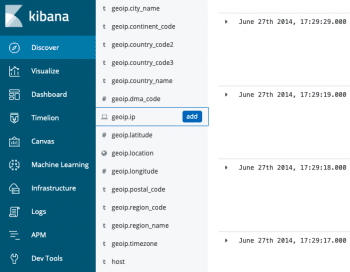
- geo-ip: Extracts information from IP addresses
- date: Extracts date and time from standard
Logstash structures and enhances the data collected from different sources to output it into Elasticsearch, which is a NoSQL database that can store data and provide real-time search over that multi-valued data. Logstash has a variety of outputs that let you route transformed data where you want it, flexibly.

2. Elasticsearch
Elasticsearch is a distributed open source search engine released under the Apache licence. It is a REST API layer over Apache’s Lucene (https://lucene.apache.org/). It provides horizontal scalability, reliability and real-time search through the documents. Elasticsearch is able to search faster because it uses indexing to go over documents. Lucene (the storage engine of Elasticsearch) stores the data using a technique called inverted indexing. This storage architecture lets Elasticsearch provide functionalities like aggregation (similar to GROUPBY in SQL), which helps when doing complex queries on data.
Indexing
Indexing is jargon for inserting data in Elasticsearch, which stores data as documents contained under an index. The index can be thought of as a table in SQL. An Elasticsearch cluster can have multiple indices, which in turn contain multiple types. These types then have multiple documents. A document is similar to a row in SQL. Documents can have multiple fields that provide information about a data object.
Here is an example:
- A POST statement is used for creating an index.
- Here, iiitb is an index.
- ‘Student’ is one of the types under iiitb. Others are professors, staff and security.
- Inside the brackets, we have a document under the type ‘student’.
By looking at the example stated above, we observe that there wasn’t a need to perform any architectural work specifically, like creating the index or defining the types of a field as in an RDBMS. Elasticsearch stores this data as documents using inverted indexing.
Inverted indexing
Elasticsearch uses an inverted index to achieve a fast full-text search over documents. An inverted index consists of all the unique words in the document, and each unique word is mapped to the list of documents containing it.
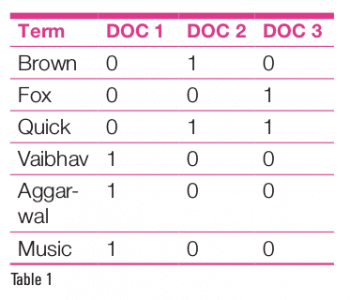 Table 1 considers three documents and six words. Each column shows if the document contains the corresponding word. The way in which Elasticsearch stores this data is called inverted indexing.
The inverted index may hold a lot more information than just the list of the documents containing a unique term. It may have a count of documents, the number of times the term appears in the document, the length of the document, and many other valuable insights.
Indexing involves tokenisation and normalisation, which is essentially an analysis of the document. The data from each field is broken into terms, and then normalised into a standard form to improve ‘searchability’.
Token filters used in analysis to increase search efficiency are listed below.
- Stop words: Removing frequently occurring words like the, is, they, etc.
- Lower casing: All words are changed into lower case for better results.
- Stemming: This involves using only the root word. The extra tense-defining part is removed; e.g., swimming and swimmer can be stemmed to swim.
- Synonyms: This filter merges the occurrences of words with the same meaning.
A separate word known as the token is mapped to the documents carrying that word. Therefore, when we are searching for a document with a particular word or phrase in our data, we don’t have to search the whole document. Instead, indexes will directly give the document associated with the desired word or phrase.
Indexed documents are then sent into a buffer, and wait for a certain period to get stored as segments. Segment data is divided and stored into small blocks called shards. This reduces the time taken for the document to become available for search after the process of indexing. In versions before 6.7.0, Elasticsearch is used to directly store to disks using the fsync() function, which is very costly as it involves directly writing to the disk. In Elasticsearch 6.7.0, the latest version, this has been changed to a file cache system that stores data in a buffer first, and then commits it to the disk, increasing the performance.
 As can be seen in Table 2, after analysis, stop words (like ‘the’) are removed, synonyms combined (like ‘sad’and ‘upset’) and stemming is done
(‘swimming’ and ‘swimmer’ to ‘swim’).
Shard is a low-level worker unit that holds just a slice of all the data. Index, as mentioned above, is just a logical name space that points to one or more shards. Elasticsearch distributes the given data in clusters by storing them as shards, which are then allocated to nodes present in the cluster. Elasticsearch needs to find the shard where it has saved a particular document. Therefore, the process should be deterministic and can be described as follows:
shard number = Hash( _id ) % number_of_primary_shards
After fixing the shard, we have a way to find the location of any document. This means that any node in the cluster knows about every document and can forward the call to the correct node.
Under the hood
The Lucene engine stores data in shards, i.e., data blocks. A node can have many shards but this creates a big, single point of failure. Elasticsearch handles failure by doing replication across the cluster. We have to mention the number of primary index shards at the time of indexing. This fixes the number of primary nodes, and helps to coordinate in finding the location of appropriate nodes.
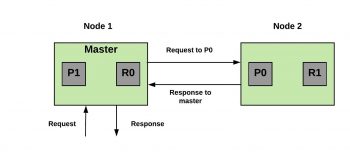
Let us say that we have two primary indexes and a two-node architecture.
The master node finds the shard containing the required documents (here, Node 2) and forwards the request to the corresponding node, as shown in Figure 6.
The effect of replication on queries
Insert: We send the request to the master node (each cluster has one), which finds the shard containing the document with the help of _id. The document is saved to the primary shard. If successful, the request is forwarded to the replica nodes in parallel and while inserting a document, Elasticsearch will locate the primary shard for the index and insert the document there.
Search: The related shard will be retrieved based on the following formula. Using round robin scheduling on the primary or replica nodes, one is chosen to carry out the current query. Round robin scheduling between primary and replicated nodes optimises the load on the search engine. The explained architecture uses round robin scheduling to balance the load on nodes.
Delete: The delete request follows similar steps as inserting. The master node finds the associated primary shard and deletes the document from there. Afterwards, it will also be deleted from replicated shards.
3. Kibana
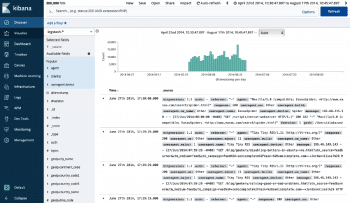
Kibana is a tool to visualise Elasticsearch data in real-time. It provides a variety of visualisations to get the best meaning out of your data. Dashboards can be created according to use cases, and get updated with new data automatically.
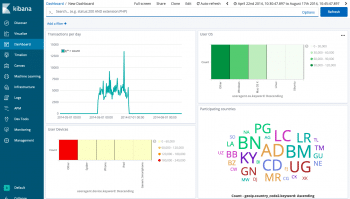
Kibana is a visualisation tool built on top of Elasticsearch, which connects to the latter using Elasticsearch’s REST APIs. It helps us understand data better from a non-developer perspective by providing various forms such as tables, rows, charts, geo maps, heat maps, and so on.
Some of the main features of Kibana are:
- Leverages the aggregation capabilities of Elasticsearch
- Has many predefined visualisations and it is very easy to define new ones using Vega
- Can plot complex data like geo-data, time series metrics, relationship graphs, etc
- Unsupervised machine learning has been added to detect anomalies in Elasticsearch data
- Dashboards can be made and transported in the form of PDF, PNG or level-controlled links
- Alerts and notifications can be set up for any specific query
The ELK stack helps users to collect data from various sources, enhance it and store it in a self-replicating distributed manner. Stored data can be accessed in real-time and can be presented to the user in various forms such as pie-charts or geo-mapping, with the help of Kibana. It helps enterprises in collecting data to provide it to businesses and users in real-time.


