This article introduces the reader to Sourcetrail, a cross-platform source explorer, formerly known as Coati. Though Sourcetrail supports C, C++, Java and Python, we’ll focus on C/C++ in this article.
Have you ever tried to explore any source code without proper documentation? You will know the complexity of code analysis that is unfamiliar. Many cross-reference tools are available in the market, some of which are proprietary and some are limited to the command line. Sourcetrail is one such tool, which is free and open source, with a rich visual interface.
Source code analysis and visualisation support from this tool makes life easier for programmers, debuggers and testers alike, making them more productive with unfamiliar source code. Unlike debugging or profiling tools, this is a static analysis tool, i.e., it indexes the entire code without execution. Thus, there is no narrowing down of indexing.
Setup
You can download Sourcetrail from https://www.Sourcetrail.com/downloads and follow the steps given in https://www.Sourcetrail.com/documentation/#Installation for installation. Here is a brief summary of the setup in the Linux environment:
- Download Sourcetrail_xxx_Linux_64bit.tar.gz
- Extract and run install.sh with admin privileges.
- This will install to /opt/Sourcetrail, and symink is created under /usr/bin/Sourcetrail.
- You can now launch it using the command Sourcetrail or create a desktop launcher shortcut.
Getting started
Once you launch Sourcetrail, a wizard appears to create a new project; you can open the existing project or choose from recent projects.
Let’s go through some steps on how to create a new project and visualise some C++ source code as an example.
- Click on Project -> New Project and fill in the project name and location.
- Click on Add Source Group, and choose the Empty C++ Source Group under C++.
- Choose the desired C++ standard in the next wizard, and skip cross-compilation options for now.
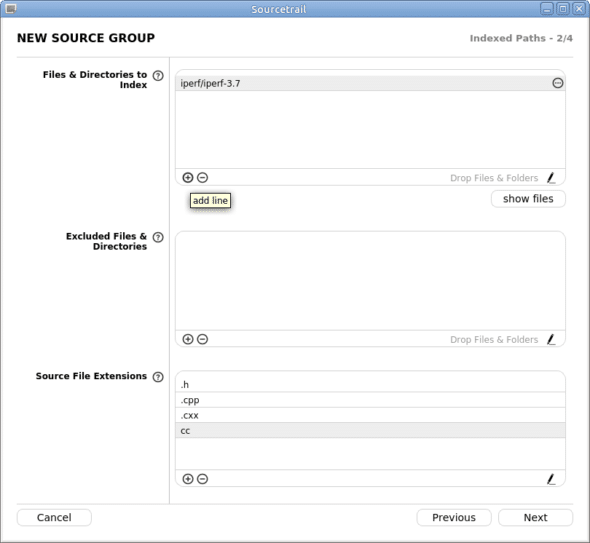
- Select the path in which you would like to index the source (files and directories to index).
- Choose Source File Extensions (typically, .h should be fine).
- If your source depends on external header files, please select Include Paths.
- Choose any compiler flags necessary, e.g., symbol definitions required for conditional inclusion.
- Finally, click on Create, and then on Start.
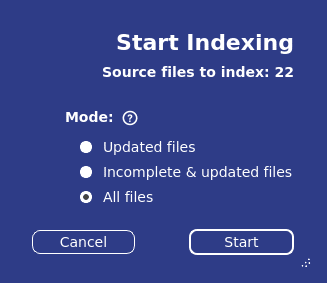
A wizard will prompt you to start indexing code. The same wizard appears when you edit the project (menu path: Project -> Edit Project) or when you refresh the project manually.
Source visualisation and navigation
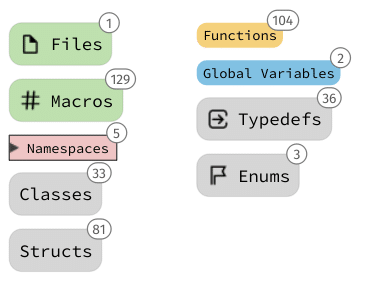
Once the indexing is complete, you can visualise the indexed code as external symbols like files, functions, classes, name spaces/packages, structs, unions, macros, typedefs, Enums, global variables, etc. The summary of indexing is on the right side pane.
You may ignore some errors initially, as the configuration is incomplete. To resolve these errors, you can update the configuration step by step, like the PATH of external header files, global include paths, compilation flags, filtering of file extensions, exclusion of some files and directories, and pre-compiled headers and flags. The indexing wizard appears on editing the project configuration (Figure 2).
You can navigate to any symbol under a particular section, which has a nice visualisation with suitable dependencies on the left side pane and concerned code on the right side. You can click on any cross-reference symbol, which will navigate to the concerned header/source file.
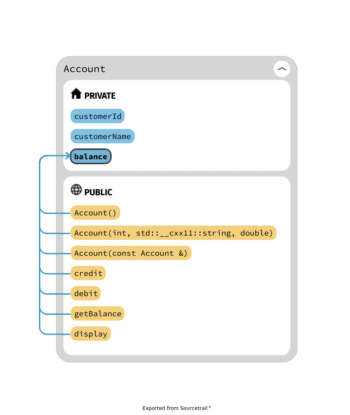
Figure 4 gives an example of a single class visualisation, with public and private members.
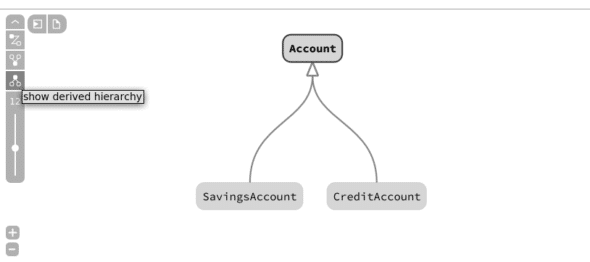
Figure 5 gives an example of visualising class relationships (inheritance in this case). For a better view, choose to show derived hierarchy/icons on the left side.
You can also view non-indexed symbols that are beyond the current scope of the code. At any point we can navigate between views using Back and Forward icons, list all past views with the History icon, and go back to the overview with the Home icon. You can use the Refresh icon when some files are updated externally and Sourcetrail cannot detect the changes; in this case, the indexing wizard appears again (as in Figure 2). Equivalent menu options are available under the History menu.
Multiple tabs can be opened to have different views of the same code, e.g., classes in one tab, header files in another tab, etc.
We can take a snapshot of any view as an image, using the context menu option ‘Save as image’.
Attaching source code from other IDEs
Many times, you may find the source code under existing projects in popular IDEs like Visual Studio, Code Blocks, Qt Creator, etc. Examples are:
- Visual Studio solution for C/C++
- Code Blocks project for C/C++
- Maven/Gradle project for Java
We can also attach source code in the form of clang JSON compilation database. You can generate this as follows for:
- CMake based projects, which define the flag CMAKE_EXPORT_COMPILE_COMMANDS.
- Make projects; here, you can run the make command in the presence of the external tool Bear. You can build Bear from https://github.com/rizsotto/Bear or via package managers like apt in Ubuntu.
- Qt Creator v4.8 (bundled with QtSDK 5.12) onwards comes with an option to generate a compilation database under the build menu.
Code editor plugins
Sourcetrail comes with a rich set of plugins to integrate with many popular IDEs/editors like Atom, Clion, Eclipse, Emacs, IntelliJ IDEA, Qt Creator, Sublime, Vim, VS Code and Visual Studio ID. With these plugins you can send the location from the editor to Sourcetrail, to see all the symbols found at that point. Some of these plugins support generation of the Clang compilation database, and you can attach this with Sourcetrail manually. Also, from the Sourcetrail code pane, you can switch to IDE, with the context menu option ‘Show in IDE’ for any symbol.
Please refer to https://www.Sourcetrail.com/documentation/#CodeEditorPlugins for the IDE/editor of your choice.
Source analysis fest
Here are some interesting libraries in C/C++; do try analysing a few of these with Sourcetrail, depending on your interest and the need to get a better understanding:
- JSON for modern C++: https://github.com/nlohmann/json
- iPerf API: https://iperf.fr/iperf-download.php#source
- QtSensors API: https://github.com/qt/qtsensors
- RTIMU library API: https://github.com/RPi-Distro/RTIMULib
- json-c API: https://github.com/json-c/json-c
- Point cloud library: https://github.com/PointCloudLibrary/pcl
- WiringPi API: https://github.com/WiringPi/WiringPi
- mbed driver, RTOS API: https://github.com/ARMmbed/mbed-os/
- curl APIs: https://github.com/curl/curl
- Paho C library: https://github.com/eclipse/paho.mqtt.c
| Note: Some of these libraries have rich documentation; you can just compare the official documentation with the Sourcetrail outcome. |
You can try some more libraries, as per your domain interest/background, in other supported languages too, such as Java and Python. You can also attach any custom code available with you and visualise it.
This article has given you a glimpse of the features of Sourcetrail, and some initial hands-on pointers. Please explore the tool in depth and gain confidence when dealing with unfamiliar code.


