

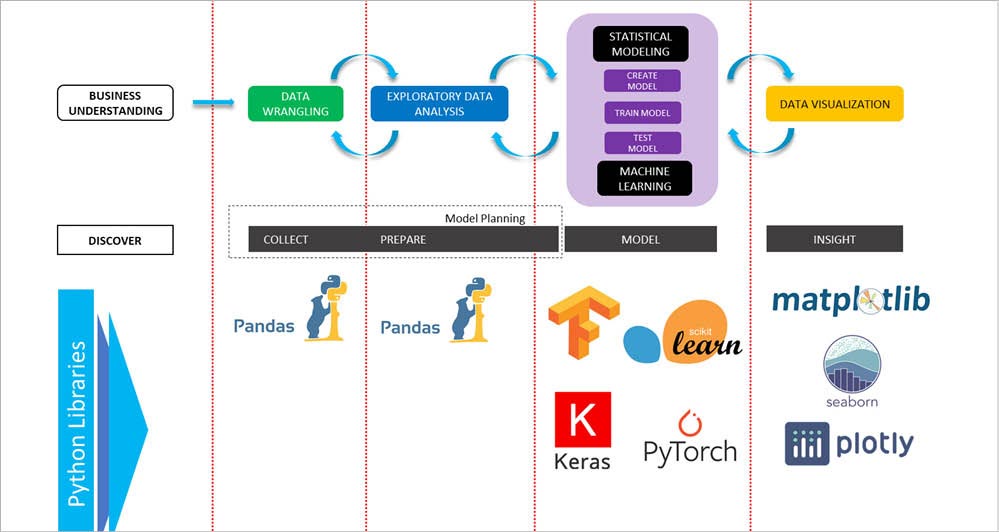
The typical life cycle of a data science project involves jumping back and forth among various interdependent data science tasks using a range of tools, techniques, frameworks programming, etc. A data scientist typically needs to be involved in tasks like data wrangling, exploratory data analysis (EDA), model building and visualisation. Python provides almost all the necessary tools to effectively carry out these tasks, with dedicated libraries for each step.
Python comes with powerful libraries such as Pandas, Matplotlib, Plotly, Scikit-learn, etc, and advanced deep learning libraries such as TensorFlow, Keras, etc. Figure 1 explains a few widely used Python tools at different steps of a data science project.
Pandas, your buddy for Exploratory Data Analysis (EDA)
Key features
- Python version support: Officially Python 3.6.1 and above.
- Open source, fast, powerful, flexible and easy to use open source data analysis and manipulation.
- Built on top of the NumPy package, a lot of the structure of NumPy is used or replicated in Pandas. Data in Pandas is often used to feed statistical analysis in SciPy, plotting functions from Matplotlib, and machine learning algorithms in Scikit-learn.
- Before all of your fancy machine learning, you will have to explore, clean and process your data thoroughly. For that, you need Pandas. Literally, you get a Microsoft Excel inside Python.
Tricks to try out!
The primary two components of Pandas are the Series and DataFrame. A Series is essentially a column and a DataFrame is a multi-dimensional table made up of a collection of Series.
# Creating a DataFrame
import pandas as pd
data = {
‘column_a’: [‘one’, ‘two’, ‘three’, ‘four’],
‘column_b’: [101, 102, 103, 104],
‘column_c’: [201, 202, 203, 204],
‘column_d’: [401, 402, 403, 404]
}
df1=pd.DataFrame(data)
df1
# Reading CSV/JSON
df = pd.read_csv(‘purchases.csv’)
df = pd.read_json(‘purchases.json’)
df

# Converting back to a CSV, JSON,
df.to_csv(‘new_purchases.csv’)
df.to_json(‘new_purchases.json’)

# Handling duplicates
temp_df = temp_df.drop_duplicates()
temp_df.shape
How to work with missing values? There are two options in dealing with nulls:
- Get rid of rows or columns with nulls.
- Replace nulls with non-null values, a technique known as imputation:
movies_df.isnull().sum()
movies_df.dropna()
Other than just dropping rows, you can also drop columns with null values by setting axis=1: movies_df.dropna(axis=1)
Imputation is a conventional engineering technique used to keep valuable data that has null values. It aims to replace missing data with substituted values.
#Age is a column name for our train data
mean_value=train[‘Age’].mean()
train[‘Age’]=train[‘Age’].fillna(mean_value)#this will replace all NaN values train[‘Age’]=train[‘Age’].fillna(median_value)
One alternative to using a loop to iterate over a DataFrame is to use pandas.apply().
To print the first three rows from emp.csv, type:
import pandas as pd
from statistics import *
df = pd.read_csv(“emp.csv”).head(3)
df
| empid | name | dept | salary |
| 1 | jack | health | 20000 |
| 2 | rohan | science | 30000 |
| 3 | tinku | sales | 15000 |
To convert to all caps without loop, type:
allcaps = lambda c: c.upper()
df[‘name’]=df[‘name’].apply(allcaps)
df.head(3)
| empid | name | dept | salary |
| 1 | JACK | health | 20000 |
| 2 | ROHAN | science | 30000 |
| 3 | TINKU | sales | 15000 |
Apply formulae to all rows as follows:
def sal_increment(row):
return row[‘salary’]+row[‘salary’] * 0.50

df[‘revised_sal’]=df.apply(sal_increment, axis=1)
df
| empid | name | dept | revised_salary |
| 1 | JACK | health | 30000 |
| 2 | ROHAN | science | 450000 |
| 3 | TINKU | sales | 22500 |
Scikit-learn: an impressive machine learning library in Python
Key features
- Free machine learning library for Python with inbuilt ML algorithms — vector machine, random forests and k-neighbors.
- Built on NumPy, SciPy and Matplotlib.
- Scikit-learn comes with a few standard data sets; for instance, the iris and digits data sets for classification and the diabetes data set for regression.
Tricks to try out!
Impute missing values: Scikit-learn offers multiple ways to impute missing values. Here, we consider two approaches. The SimpleImputer class provides basic strategies for imputing missing values (through the mean or median for example). A more sophisticated approach is the KNNImputer class, which provides imputation for filling in missing values using the K-Nearest Neighbors approach. Each missing value is imputed using values from n_neighbors nearest neighbors that have a value for the particular feature. The values of the neighbours are averaged uniformly or weighted by distance to each neighbour.
#Example of using both imputation methods:
from sklearn.experimental import enable_iterative_imputer
from sklearn.impute import SimpleImputer, KNNImputer
from sklearn.datasets import make_classification
import pandas as pd

X, y = make_classification(n_samples=5, n_features=4, n_classes=2, random_state=123)
X = pd.DataFrame(X, columns=[‘Feature_1’, ‘Feature_2’, ‘Feature_3’, ‘Feature_4’])
X.iloc[1, 2] = float(‘NaN’)
X.iloc[1, 2] = float(‘NaN’)
imputer_simple = SimpleImputer()
pd.DataFrame(imputer_simple.fit_transform(X))
imputer_KNN = KNNImputer(n_neighbors=2, weights=”uniform”)pd.DataFrame(imputer_KNN.fit_transform(X))
To split a data set into a train test easily for ML implementation, type:
X = list(range(15))
print (X)
y = [x + x^2 for x in X]
print (y)

import sklearn.model_selection as model_selection
X_train, X_test, y_train, y_test = model_selection.train_test_split(X, y, train_size=0.70,test_size=0.30, random_state=101)
print (“X_train: “, X_train)
print (“y_train: “, y_train)
print(“X_test: “, X_test)
print (“y_test: “, y_test)

OUTPUT
[0, 1, 2, 3, 4, 5, 6, 7, 8, 9, 10, 11, 12, 13, 14]
[2, 0, 6, 4, 10, 8, 14, 12, 18, 16, 22, 20, 26, 24, 30]
X_train: [5, 0, 14, 4, 8, 9, 7, 6, 1, 11]
y_train: [8, 2, 30, 10, 18, 16, 12, 14, 0, 20]
X_test: [13, 2, 3, 12, 10]
y_test: [24, 6, 4, 26, 22]
Matplotlib, Seaborn, Plotly: the essential visualisation libraries
In Python, there are multiple options for visualising data according to need. Because of this variety, it can be really challenging to figure out which one to use when.
Matplotlib is considered as the old grandfather of the Python visualisation packages. It is extremely powerful, but with that power comes some level of complexity. You can typically do anything you need utilising a Matplotlib library, but this is not always so simple to figure out.
Matplotlib originated nearly a decade before Pandas and hence isn’t outlined for utilising the Pandas DataFrame. So for visualising data from a Pandas DataFrame, you have to extract each Series and often concatenate them together into the right format. It would be better to have a plotting library that can use the DataFrame labels in a plot.
Seaborn gives an API on Matplotlib that gives rational choices for plot fashion and colour defaults, characterises straightforward high-level capacities for common measurable plot sorts, and coordinates with the usefulness of Pandas.
Plotly is a JSON based plot tool for interactive visualisation. Graphs or plots can be defined by a JSON object using two keys, named ‘data’ and ‘layout’. It can create interactive features easily. Most plots come with hover labels, and legends for groups is another amazing feature of this library.
Tricks to try out!
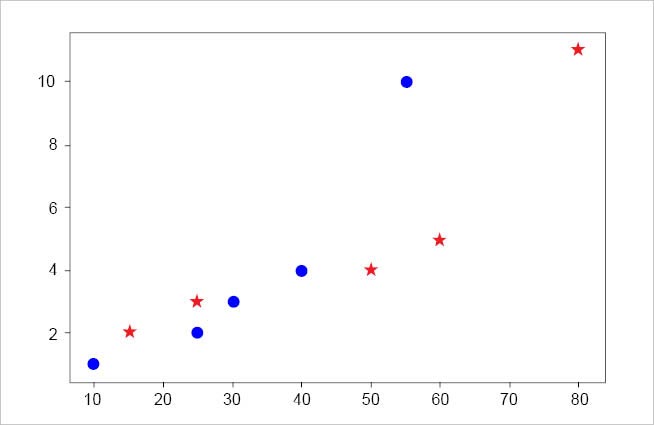
For a simple scatter plot using Matplotlib library, type:
import matplotlib.pyplot as plt
%matplotlib inline
# Draw two sets of points
plt.plot([10,25,30,40,55], [1,2,3,4,10], ‘bo’) # blue dots
plt.plot([15,25,50,60,80], [2,3,4,5,11], ‘r*’) # red stars
plt.show()
The output is given in Figure 2.
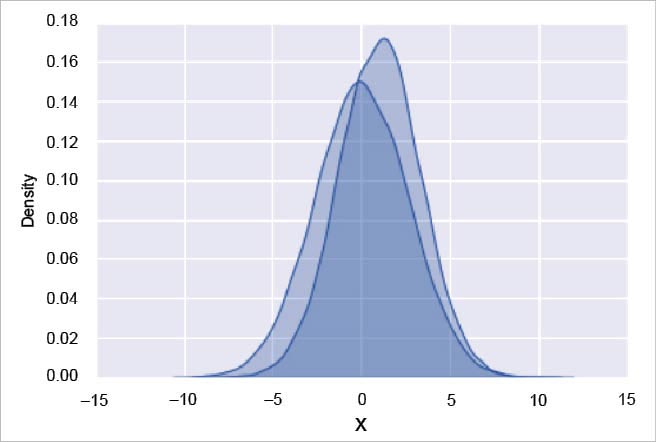
Often, in statistical data visualisation, all you want is to plot histograms and joint distributions of variables. We have seen that this is relatively straightforward in Matplotlib. Rather than a histogram, we can get a smooth estimate of the distribution using a kernel density estimation, which Seaborn does with sns.kdeplot:
import seaborn as sns
sns.set()
import numpy as np
import pandas as pd
data = np.random.multivariate_normal([0, 1], [[5, 6], [6, 2]], size=30000)
data = pd.DataFrame(data, columns=[‘X’, ‘Y’])

for col in ‘XY’:
sns.kdeplot(data[col], shade=True)
The output is given in Figure 3.
To use Plotly to draw a scatter plot using the iris data set, type:
import plotly.express as px
iris_dataframe = px.data.iris()
fig = px.scatter(iris_dataframe, x=”sepal_width”, y=”sepal_length”, color=”species”,
size=’petal_length’, hover_data=[‘sepal_length’], size_max=35)
fig.show()
The output is shown in Figure 4.

Plotly is a fantastic tool for quick interactive plotting. The code given below shows its power. A 30 line code gives a clear insight into how COVID-19 spread across countries since its inception. You can experience the interactive part of it at https://www.kaggle.com/dibyendubanerjee/covid19-spread-visualization.
import plotly.express as px
import pandas as pd
import plotly.graph_objects as go
import numpy as np
url=’https://raw.githubusercontent.com/CSSEGISandData/COVID-19/master/csse_covid_19_data/csse_covid_19_time_series/time_series_covid19_confirmed_global.csv’

def read_file(url):
df = pd.read_csv(url)
return df

def filter_specific_country(df, selected_countries):
df1=df[df[‘Country/Region’].isin(selected_countries) ]
countrywise_grouped_df = df1.groupby(df[‘Country/Region’]).sum().drop([‘Lat’,’Long’], axis=1)
countrywise_grouped_df
return countrywise_grouped_df

def transpose_and_reformat_data(df):
df_t=df.transpose()
df_t.reset_index(inplace=True)
df_t.rename(columns={‘Country/Region’:’Index_Col’, ‘index’:’Dates’}, inplace=True)
return df_t

confirmed_dataset = read_file(url)
selected_countries=[‘India’,’China’,’Italy’,’Spain’,’France’,’Australia’,’Germany’,’Japan’,’Korea, South’,’Pakistan’,
‘Russia’,’United Kingdom’,’Canada’,’Iran’,’Brazil’,’Singapore’,’South Africa’,’US’]
ds=filter_specific_country(confirmed_dataset,selected_countries)
data=transpose_and_reformat_data(ds).melt(id_vars=[“Dates”], var_name=”Country”, value_name=”Confirmed_Count”)
#plot_title=”Global Spread of Covid-19: (Selected Countries)”
plot_title=’Visualizing the spread of Novel Coronavirus COVID-19 (2019-nCoV) - Created by Dibyendu Banerjee’
fig = px.bar(data, y=”Country”, x=”Confirmed_Count”, color=”Country”,
animation_frame=”Dates”, range_x=[1,14000000], orientation=’h’ )
fig.update_layout(title=plot_title,yaxis_title=’Countries’, xaxis_tickangle=90, font=dict(family=”Arial”,size=10,color=”#7f7f7f”))
fig.show()
The output is shown in Figure 5.

Tensorflow, Pytorch, Keras: A brief introduction to the three main frameworks
TensorFlow, a product from Google, is an end-to-end machine learning library that helps to perform an extremely wide range of downstream tasks, with the primary focus on training and inference of deep neural networks. It is a symbolic math library based on dataflow and differentiable programming. TensorFlow bundles together machine learning and deep learning models and algorithms.
PyTorch is TensorFlow’s direct competitor developed by Facebook, and is widely used in research projects. It allows almost unlimited customisation and is well adapted to running tensor operations on GPUs (similar to TensorFlow).
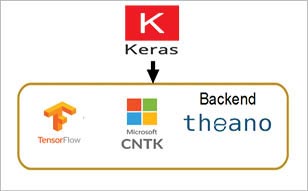
Keras is built on top of TensorFlow, which makes it a wrapper for deep learning purposes. It is incredibly user-friendly and simple to use. A solid asset is its neural network block modularity and the fact that it is written in Python, which makes it easy to debug. Keras is backed by Google, Microsoft, Amazon, Apple and others. It is not a full-fledged deep learning framework, but is a nice wrapper around the libraries such as TensorFlow, CNTK, and Theano. Keras can be used directly; however, it is inbuilt with TensorFlow 2.0.
The following code is for where Keras is used directly:
import keras keras.backend.backend() ‘tensorflow’
from keras.models import Sequential from keras.layers import Flatter, Dense, Activation
model = Sequential() model.add(Flatten(input_shape=[28, 28])) model.add(Dense(100, activation=”relu”)) model.add(Dense(10, activation=”softmax”))
The following code is used where Keras is inbuilt with TensorFlow 2.0:
from tensorflow import keras
model = keras.Sequential([
keras.layers.Dense(10, input_shape=(784,), activation= sigmoid )
] )


