


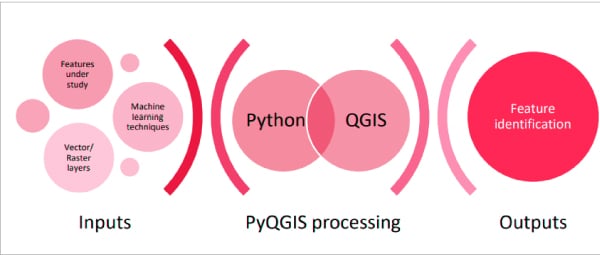
Various data and image processing techniques, along with machine learning algorithms, make it possible to study, analyse, understand and identify unknown and lesser-known facts via supervised or unsupervised learning. This article explains the use of PyQGIS to identify reefs in the Indian coastal region.
It was in the middle of the last century that mankind started exploring regions beyond the earth through satellites and space missions. This exploration is broadly classified into in situ or onsite observation and remote sensing. The in situ observations are limited and the major challenge is to reach out to parts of the Earth and space for monitoring the physical characteristics by acquiring information through reflected and emitted radiation. These can be achieved with the help of sensors and cameras on board satellites, aircraft, unmanned aerial vehicles and drones. Passive remote sensing involves the use of charge coupled devices, radiometers, film photography and infrared. Radars and LiDARs are active remote sensing elements that emit energy, and scan locations/objects based on the radiation that is reflected or back scattered from the target. The observations are either some data or image.
Geographic information systems (GIS) integrate data, location, maps and information, thereby providing a platform to understand geographical patterns. Popular open source GIS tools are quantum GIS (QGIS), geographic resources analysis support systems (GRASS GIS), system for automated geoscientific analyses (SAGA GIS) and MapWindow. Machine learning owes its popularity to open source programming/GUI choices like WEKA, KNIME, R and Python programming. The merger of GIS and machine learning has opened new avenues in research to explore beyond what is visible through sensors.
| Raster maps | Vector maps | |
| Created by | Created with pixels | Created with mathematical formulae |
| Scaling | Quality loss when scaling is done | Scalable to any size |
| Programs used | Adobe Photoshop, Corel Painter, Gimp, Artweaver, Pixlr X | Adobe Illustrator, Sketch, Coreldraw, Affinity Designer, Inkscape |
| Comprise | Raster data is made up of pixels (also grid cells). These are usually regularly spaced and square | Real-world features in maps are represented as points, lines, and polygons (areas) |
| File types | .jpg, .png, .gif, .tiff, .psd, .bmp | .ai, .eps, .cdr, .svg, .pdf, .dfx |
| Advantages | The inherent nature of raster maps, e.g., one attribute maps, is ideally suited for mathematical modelling and quantitative analysis. | Topology rules can help data integrity with vector data models. Network analysis and proximity operations use such an approach. |
| Drawback | Raster maps reflect only one attribute or characteristic for an area. Processing of diverse characteristics becomes cumbersome | Vector data is processing intensive. Any feature edits require updates on topology. With many features, vector manipulation algorithms are complex |
resources analysis support systems (GRASS GIS), system for automated geoscientific analyses (SAGA GIS) and MapWindow. Machine learning owes its popularity to open source programming/GUI choices like WEKA, KNIME, R and Python programming. The merger of GIS and machine learning has opened new avenues in research to explore beyond what is visible through sensors.
In this article we are using the Python console of the quantum GIS platform — PyQGIS.
Maps are available either in raster or vector form for study and we can choose them depending on our task, software and region of interest. Vector data is focused on modelling discrete features with precise shapes and boundaries. Raster data is more about modelling continuous phenomena of the earth and images. The same can be imported to the Project template of the QGIS window.
The map used in the present setup is downloaded from https://www.naturalearthdata.com. Natural Earth Vector comes in ESRI shapefile format, the de facto standard for vector geodata. Character encoding is UTF-8. Natural Earth Raster comes in TIFF format with a TFW world file. All Natural Earth data uses the geographic coordinate system (projection), WGS84 datum. Natural Earth shapefile character encoding is specified in the code page flag in the shapefile’s DBF file; for additional compatibility it is also specified in the CPG file. Natural Earth’s WGS84 projection is specified in shapefile’s PRJ file.
Natural Earth is a public domain map data set available at 1:10m, 1:50m, and 1:110m scales. Featuring tightly integrated vector and raster data, with Natural Earth you can make a variety of visually pleasing, well-crafted maps with cartography or GIS software. Natural Earth was built through a collaboration of many volunteers and is supported by NACIS (North American Cartographic Information Society). It is free for use in any type of project.
The present map belongs to a category of most detailed maps — major coral reefs from WDB2 or World Data Bank 2. I am using QGIS 3.22 Białowieża version and working using its Python console. I have modified the reefs data set by appending the names of the nearest island and limited the entire list to 98 reefs along the western coast of India, including other countries.
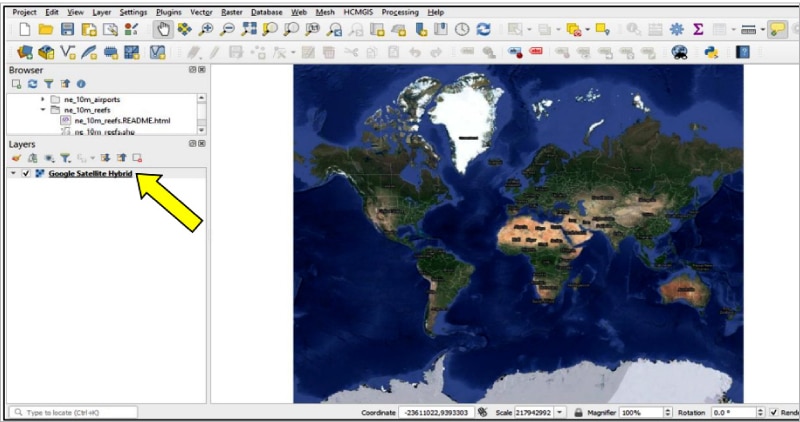
Step 1: Open a new project in QGIS and select ‘HCMGIS > BaseMap > Google Satellite Hybrid’.
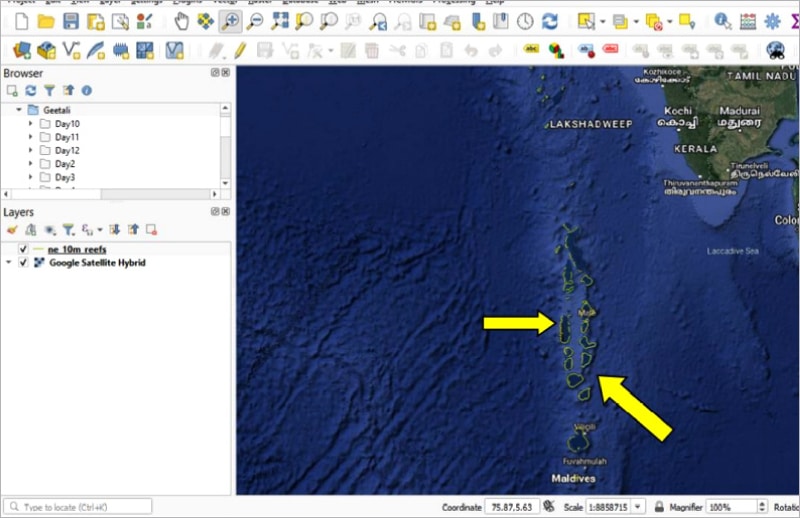
Step 2: This should load the previously geo-referenced global map on the Project view. The moment this is done, Layers (left lower section) will show the Google satellite hybrid image. Pan to the western water bodies of India and zoom on the location, as seen in Figure 2.
Step 3: Select all the map files related to the desired features and convert them to .kml using any tool freely available online. You can set the output reference settings to Lat long Wgs 84 standard and choose to convert. Download the .kml file once conversion is completed. We did it using the tool at https://products.aspose.app/gis/en/conversion/shapefile-to-kml.
Step 4: Select layers that can be superimposed to this Google satellite hybrid image (refer Figure 3).
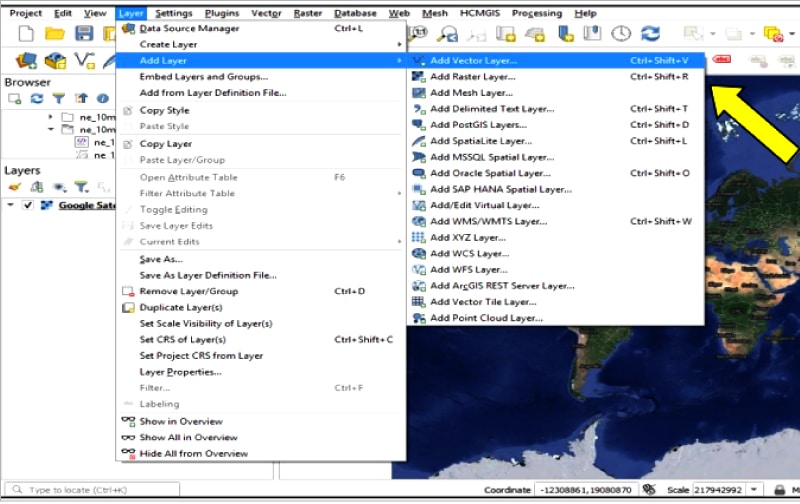
Step 5: Open the data source manager vector file addition option from the menu.
Step 6: Provide the correct path to obtain the .kml file from the download location and add it.
Step 7: Open the concerned .kml file into the Data Source Manager-Vector mode and select the Add option (middle button on the right bottom). It should display the list of eligible files that can be added to it (refer Figure 4).
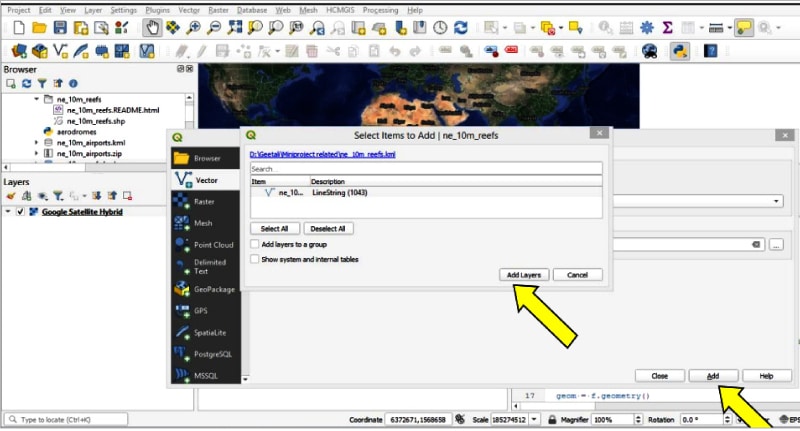
Step 8: Click Add layers (which you wish to include in the map to view).
Close the data source manager. You should be able to locate two files on the Layers window:
- The reef details file
- Google satellite hybrid image file
Remember to put the reef details in first position followed by the Google satellite hybrid image, else the reef details won’t be visible at the desired locations.
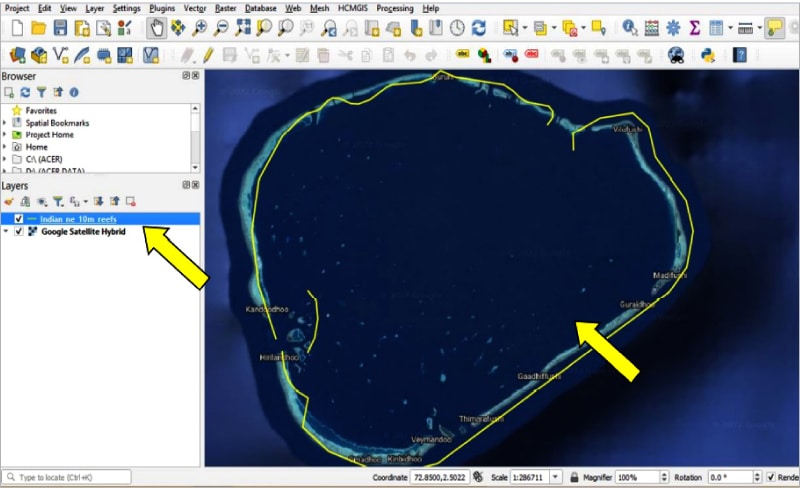
Zoom on to your region of interest or make sure you select only those reefs and islands that you wish to study. You should be able to identify specific locations that are in the Arabian Sea. They presently appear with a yellow background (see Figure 5).
You can access the properties with a right click on the reefs layer for other options.
Now, if you wish, you may alter the colour and the boundary of the symbols and change their representation.
A typical outline of the reefs located on specific islands is shown in Figure 6.
Moving on to the Python console
Python was first introduced in QGIS 0.9, and Python codes can be implemented in the QGIS environment using the following ways:
- Issue commands in the Python console within QGIS (the most popular choice and also widely implemented)
- Create and use plugins
- Automatically run Python code when QGIS starts
- Create processing algorithms
- Create functions for expressions in QGIS
- Create custom applications based on the QGIS API
A wonderful resource for learning common task execution is to download the existing plugins from the plugin repository. QGIS provides an integrated Python console for scripting. It can be accessed from the Plugins ► Python Console menu.
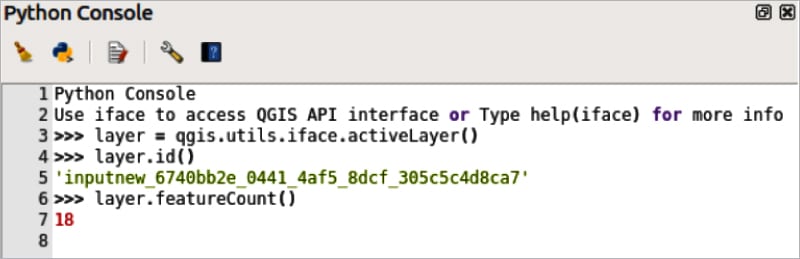
QGIS essentially works as a layer based approach, and hence it becomes vital to obtain the currently selected layer in the layer list on the top. The ID visibility is optional. If the current layer happens to be a vector layer, the features are the most vital components and so is the feature count. In the QGIS environment, the iface variable, an instance of QgisInterface, allows the user to access the map canvas, menus, toolbars and other parts of the QGIS application.
The iface.activeLayer() method gives us the currently selected layer.
>>>layer = iface.activeLayer()
>>>dir(layer)

for f in layer.getFeatures():
print (f)
Executing the code in the console will provide the output, as shown in Figure 8.
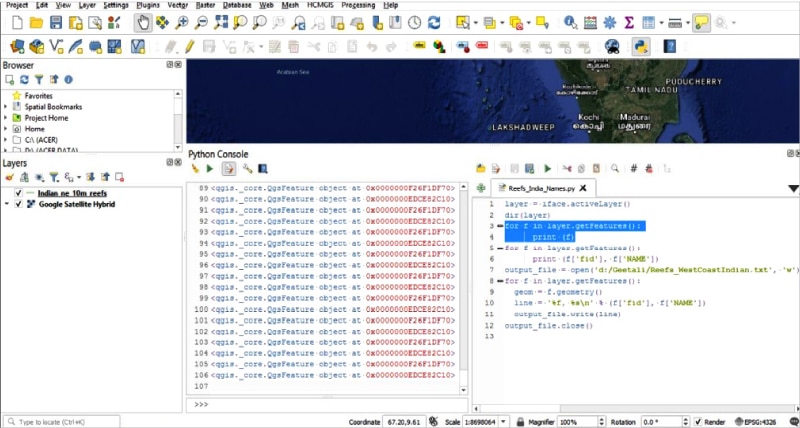
for f in layer.getFeatures():
print (f[‘fid’], f[‘NAME’])
output_file = open(‘d:/Geetali/Reefs_WestCoastIndian.txt’, ‘w’)
This will generate a .txt document at the desired location with the desired name.
Finally we will execute the code below to display the names of the reefs
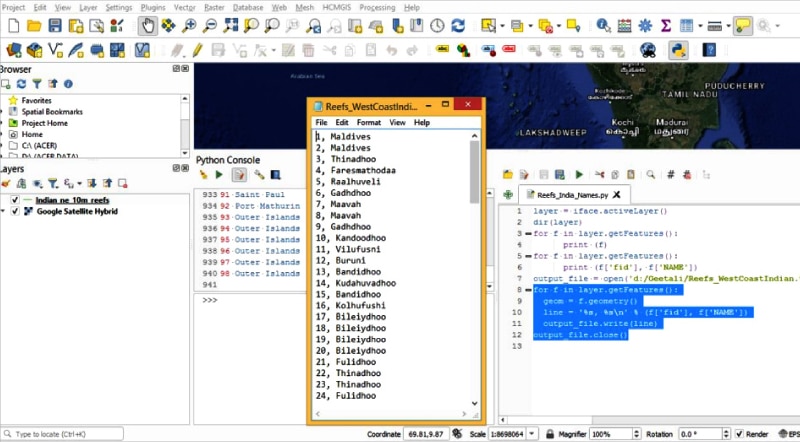
for f in layer.getFeatures():
geom = f.geometry()
line = ‘%s, %s\n’ % (f[‘fid’], f[‘NAME’])
output_file.write(line)
output_file.close()
Figure 9 shows that after complete execution of the Python code, we have successfully loaded the names of the 98 reefs on the western coast of India.


