

This article touches upon the Linux ptrace() system call and how it is used to trace and debug the system calls of a process.
Some of the most powerful and useful debugging tools in Linux are the GDB debugger and the strace. GDB debugger allows users to run the program in a controlled environment, thereby allowing them to set breakpoints, read and set variables, registers, and many other options. Strace allows the user to trace the system calls of any program.
Ever wondered how these tools work under the hood? All of this is made possible by the ptrace system call. So let’s take a look at it and find out how it can be utilised to trace a system call. This will help us understand how diagnostic tools internally utilise this system call.
Important terminologies related to ptrace()
Some terminologies to understand before we move on to the next section on how ptrace is used are listed below.
Strace: Strace is a diagnostic and debugging user space utility for Linux. It is a command line utility that is used by developers and system administrators to trace and debug the system calls and signals made by a process.
Ptrace: Ptrace is a Linux system call. Both strace and GDB internally use the ptrace system call.
Tracer and Tracee: The ptrace system call provides a means by which one process (known as the tracer) may observe and control the execution of another process (known as the tracee). The tracer is able to pause execution, and inspect and modify memory and registers in the tracee process. In short, the tracer maintains total control over the tracee.
Understanding how ptrace works
Let’s understand how ptrace is used by tools like strace to trace system calls. The ptrace system call helps us temporarily stop a running process, and read as well as modify the contents of registers and memory locations used by it. The traced program can be made to stop every time it tries to enter the kernel via a system call and every time it comes out of a system call.
Let’s create a C program which shows the first system call invoked by the tracee.
This program is created in an x86_64 based Linux machine. The program is not portable because it uses the specific registers from x86_64 architecture. If the machine architecture is different, the code needs to be modified.
Program: mystrace.c

#include <stdio.h>
#include <stdlib.h>
#include <unistd.h>
#include <sys/ptrace.h>
#include <sys/user.h> /* for struct user_regs_struct */
#include <stddef.h>

int main(void)
{
pid_t cpid;
long sc_no;

/* Create a child using fork() */
/* Parent is the tracer and child is the tracee */
switch(cpid = fork()){
case -1:
printf(“fork() failure - exit from program”);
exit(1);

case 0: /* in the child process */
ptrace(PTRACE_TRACEME, 0, NULL, NULL);
execl(“/bin/date”, “date”, NULL);

default: /* in the parent process */
wait(NULL);
sc_no = ptrace(PTRACE_PEEKUSER, cpid, offsetof(struct user, regs.orig_rax),NULL);
printf(“First system call(number) invoked by tracee is %ld\n”, sc_no);
ptrace(PTRACE_CONT, cpid, NULL, NULL);
}
}

$ gcc -o mystrace mystrace.c

$ ./mystrace
First system call(number) invoked by tracee is 59
Wed Mar 8 03:00:02 JST 2023
When the mystrace.c program is compiled and executed, it shows that system call number 59 is the first system call that is invoked by the tracee (i.e., child process). System call number 59 is for execve() system call. The execl() API internally invokes the execve() system call.
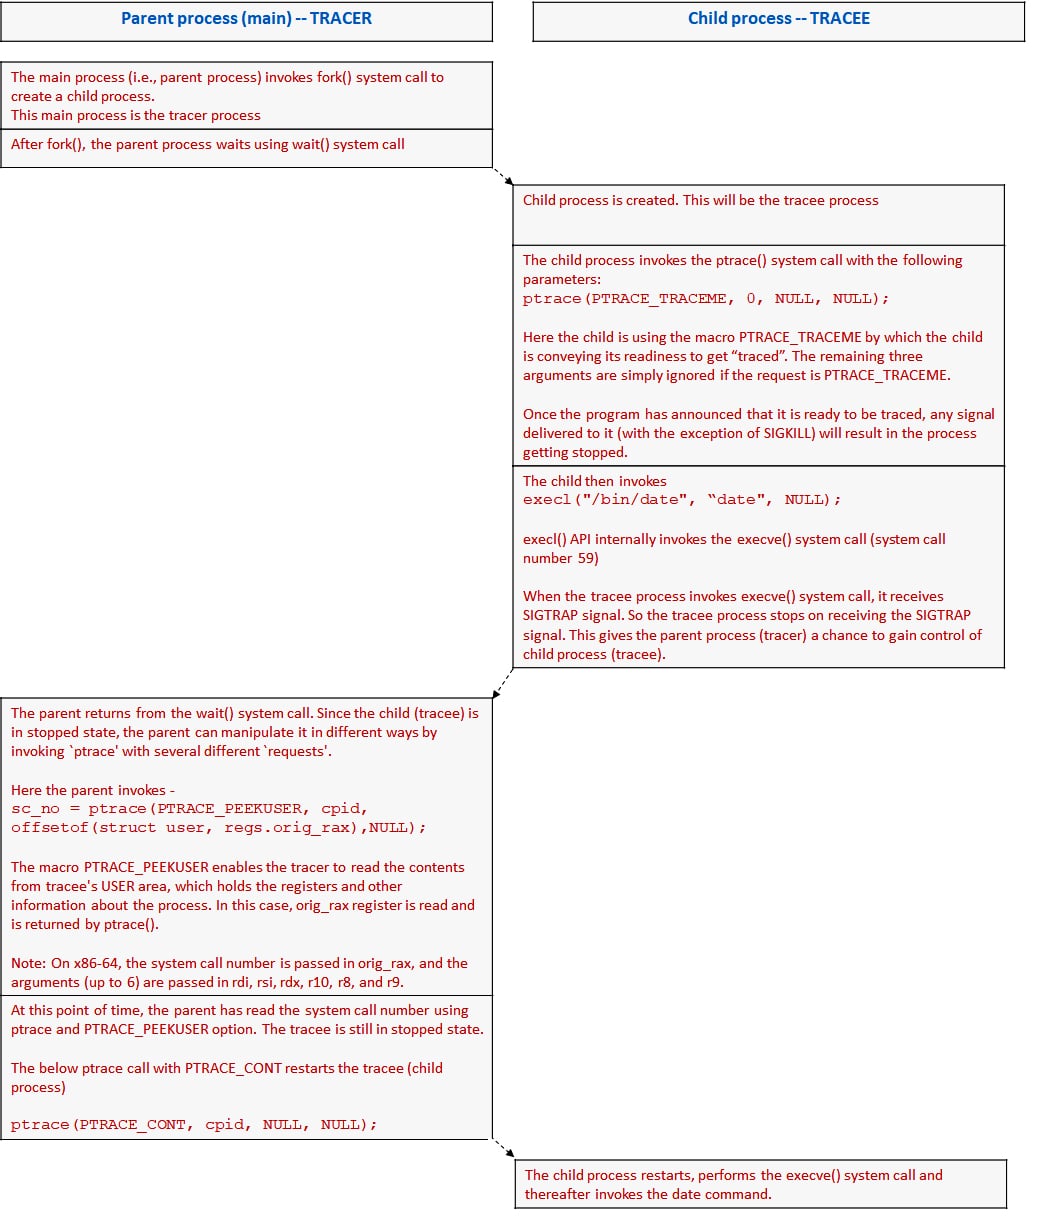
Figure 1 explains the detailed sequence of steps performed by both tracer and tracee in an x86_64 Linux environment.
Ptrace is a powerful system call that provides a range of capabilities for observing and controlling the execution of another process. It can be used for both legitimate and malicious purposes. Attackers can use ptrace to inject malicious code into a running process or modify the behaviour of the process. As a result, ptrace is often disabled and restricted on production systems.


