


Software may require a new update or release due to the need for certain capability improvements or bug fixes. In this two-part series of articles, we look into the system and method for measuring and tracking the effectiveness of software features deployed in production environments.
In a software release cycle, different types of capabilities or changes may be released to production, depending on the nature of the software, the development methodology (e.g., Agile, Waterfall) and the specific release goals. Some of the common types of capabilities are new features, user experience enhancements, bug fixes, performance/security improvements, localisation/internationalisation updates, etc. Of all these, in general, the delivery is generally around the introduction of new features, which can further be broadly classified into two different categories.
Features that are meant to solve customer problems: Customer-focused features are designed to enhance the user experience, address pain points, and provide solutions to the problems and needs of end users, thereby improving user satisfaction, attracting new customers, and retaining existing ones.
Features that are meant to solve business problems: Business-focused features related to data management, process automation, cost reduction, analytics, etc, may not always be visible to end users but are essential for the successful operation of the business and are aimed at improving the efficiency, productivity, and profitability of the organisation.
The balance between customer-focused and business-focused features can vary depending on the software’s purpose, the organisation’s goals, and the stage of development. It’s common for organisations to prioritise customer-facing features, as they directly impact user satisfaction and can help gain a competitive advantage. However, business-focused features are equally important for optimising internal operations, reducing costs, and ensuring the software’s long-term sustainability.
Problem statement
The journey of a ‘feature’ in an ideal state encompasses multiple stages that are carefully designed to ensure its successful development and implementation. These stages guide the feature through its entire life cycle, from conceptualisation to deployment and beyond.
- Scoping, discovery and framing: Defines the purpose and objectives of the feature
- Stakeholder mapping using RACI (responsible, accountable, consulted, informed) framework: Identifying and assigning roles and responsibilities to various stakeholders
- Graphing the stakeholder influence vs interest charts: Prioritising stakeholders based on their level of influence and interest in the feature
- Defining the customer problem, business problem and success metrics: Defining success metrics helps in measuring the feature’s impact and effectiveness
- Defining personas, current behaviours, and future behaviours: Understanding the target audience and their behaviours through personas
- Creating customer journey, empathy and assumption mappings: Creating a holistic view of user interactions and pain points
- SWOT (strengths, weaknesses, opportunities and threats) analysis for the product and team: Identifying internal and external factors that can impact a feature’s potential success
- Prioritisation of features: Ranking and selecting features based on their importance, feasibility and potential impact
- Solutioning: Design, development, test and deploy
- Experimentation: Observation, hypothesis, test and evidence: Data driven decision making through an experimentation process
- Implementation: Changing, adjusting and refining the feature based on the results of experimentation.
This comprehensive journey framework ensures that features are not only developed but also well-informed, tested, and continuously improved. It reflects a user-centric and data-driven approach to feature development, promoting success and satisfaction for both users and the business.
However, even after this rigorous requirement gathering process, it is common in the software development process that the deployed features do not yield the desired results for various reasons.
- Changing user needs: Changing user needs and market conditions, coupled with developmental delays, can render initially prioritised requirements obsolete.
- Lack of end user involvement and inadequate user research: The absence of end user involvement in the requirement gathering process can result in overlooking or misunderstanding their actual needs and preferences.
- Unclear business objectives: It can be challenging to prioritise requirements effectively when business objectives are not well defined.
- Incorrect assumptions: Relying on unvalidated assumptions about customer preferences made by the stakeholders can result in inaccurate prioritisation, posing a potential risk.
- Ineffective prioritisation criteria: If the criterion for prioritisation is not well-defined, it can lead to inconsistent choices. Prioritisation decisions can sometimes be influenced by the preferences of powerful stakeholders, rather than aligning with user needs or the product’s goals.
- Miscommunication: Unclear communication between stakeholders can lead to misinterpretations of what the users truly need.
- Bias: Personal biases or preconceived notions about the prioritisation may lead to incorrect choices.
- Resource constraints: Limited resources such as time, budget or skilled personnel can force teams to make trade-offs based on constraints rather than the value provided to the end user.
Delivering the wrong or ineffective features in a project can have far-reaching consequences that significantly affect the project’s overall success and can lead to several problems and challenges.
- User abandonment, customer dissatisfaction and low customer retention: Upon encountering inadequate or irrelevant features, users may choose to abandon the product leading to diminished customer satisfaction and decrease in customer retention rate.
- Cost overruns, delay in the project timelines and revenue downturn: Inclusion of inadequate features can disrupt the project’s budget, causing unexpected cost overrun and potential downturn in revenue generation.
- Resource misallocation: Incorrectly chosen features can lead to the misallocation of critical resources, thereby impeding the overall efficiency.
- Security risks and legal consequences: Inadequate features may inadvertently introduce security vulnerabilities which can lead to legal consequences.
- Technical debt: Poorly implemented or inappropriate features can contribute to technical debt, impacting long term sustainability.
- Developer productivity impact: Developers faced with the challenge of adapting to unsuitable features may experience a decline in productivity resulting in longer development cycles.
- Market share erosion: Suboptimal features can undermine the product’s competitiveness leading to a gradual erosion of market share.
Solution
In essence, ‘feature evaluation’ (measuring ‘feature effectiveness’) is a crucial step in a successful software product development life cycle. It addresses the array of challenges and complications outlined above by systematically assessing the efficacy of deployed features and taking necessary actions based on the gained insights. Feature effectiveness can be measured in two ways: ‘Quantitative indicators’ (usage metrics, conversion rates, retention rates, click-through rates, error rates, etc) and ‘qualitative feedback’ (user surveys, usability testing, A/B testing, support data, user review, etc). Quantitative data helps identify trends and patterns, while qualitative feedback offers context and deeper insights. Combining quantitative indicators and qualitative feedback provides a comprehensive picture of feature effectiveness.
Quantitative indicators can be grouped into four
Daily active users (DAU): This category of quantitative indicators focuses on the frequency and engagement of users with a product or service. DAU measures how many users interact with a platform or application daily. It provides a real-time snapshot of user activity, indicating the level of interest and dependence on the product. A high DAU suggests that a product is effectively retaining its user base and driving consistent engagement.
Session duration (SD): The session duration metrics delve into the depth of user engagement. SD tracks the average amount of time a user spends within a single session or interaction with the product. A longer session duration often indicates that users find value and contentment in their interactions, which can be a sign of a well-designed and engaging product.
Conversion rate (CR): Conversion rate metrics are crucial for understanding how effectively a product is at converting potential customers into paying customers. Whether it’s signing up for a newsletter, making a purchase, or taking any desired action, CR quantifies the success of these conversion events. A high CR signifies that the product or marketing strategy is effective in persuading users to take the desired actions.
Customer lifetime value (CLV): CLV is a comprehensive indicator that analyses the long-term profitability of customers. It quantifies the total value a customer brings to the business over their entire relationship with the company. By considering factors such as customer retention, repeat purchases, and the value of referrals, CLV offers insights into the sustainability and growth potential of a business.
All other quantitative indicators can be derived from these four major categories — e.g., monthly active users from DAU; retention rates from a combination of DAU, SD, CR and CLV; click-through rates from CR and CLV; engagement metrics from DAU, SD and CR; revenue metrics from the CLV, etc.
The method for tracking and measuring the effectiveness of the deployed user features in a production environment can be a three-step process:
- Calculating the mathematical notation or numerical representations (FEM or feature effectiveness measure, and FEI or feature effective indicators) that can clearly and quantitatively represent the effectiveness of a feature using the four categories listed earlier.
- Feed the FEM/FEI into the source and analytical systems.
- Analyse if the deployed features are yielding the desired results.
Calculating feature effectiveness measure (FEM) and relative deviations
- Category weightage (CWT)
Assigning CWT is a crucial step in creating a structured evaluation framework for various features, metrics, or aspects of a product, service, or business. CWT represents the significance or importance that each category carries within the assessment process. The total CWT should always sum up to 100 to maintain a balanced and comprehensive evaluation. However, these weightages can be adjusted based on the specific characteristics and objectives of the features being analysed.
- Importance of CWT: CWT allows decision-makers to prioritise and emphasise certain aspects of a product or business over others, aligning them with strategic goals. It helps create a clear hierarchy of importance within an evaluation framework, ensuring that critical areas receive the appropriate attention.
- Customisation for different features: Not all features, metrics, or business aspects are equal in importance. The CWT may differ from one feature to another based on their role and relevance. Features with varying objectives or characteristics may require unique CWT assignments. For instance, a high-margin, low-volume feature might give more weight to profitability (e.g., CLV), while a growth-focused feature could prioritise user engagement (e.g., DAU).
- Summation to 100: The total CWT should always equal 100 to ensure that the evaluation remains balanced and comprehensive. This constraint reflects the principle that the entire assessment is a holistic view of a product’s or business’s performance. The 100-point scale simplifies comparisons and decision-making by offering a clear, standardised basis for assessment.
- Dynamic adjustments: CWT is not fixed and can evolve over time. As business goals change, or as features or strategies are adjusted, the CWT can be modified to align with the new priorities. Data-driven approaches, such as historical performance data and market dynamics, can inform these adjustments.
- Flexibility and iteration: Assigning CWT is not a one-time process but an ongoing and iterative one. It’s essential to regularly review and adapt the weightings to keep the evaluation framework relevant. Collaboration among stakeholders, including data analysts, product managers, and executives, is often vital in determining the most appropriate CWT for each context.
In summary, CWT is a dynamic tool that allows organisations to structure their evaluations effectively, ensuring that the most critical areas are given the appropriate attention. Its flexibility and adaptability enable businesses to stay aligned with their ever-changing goals and strategies, helping them make informed decisions and drive success.
- Category value (CV)
The category value or CV represents the current measured value of a specific category. In the context of measuring software feature effectiveness, these categories are essential metrics used to assess how well a feature is performing. CV provides a snapshot of the feature’s performance at a particular point in time. It serves as a key data point for evaluating and analysing the feature’s effectiveness.
- Category monthly value (CMV): Category monthly value (CMV) is a critical metric calculated at the end of every month. It provides an in-depth and up-to-date assessment of a specific category’s performance. For example, if we consider the category of daily active users (DAU), CMV for a specific month would represent the number of users actively engaging with the software daily during that month. CMV is calculated using data obtained from the system, making it a valuable indicator of the feature’s current monthly performance.
CMV = Calculated value from the system
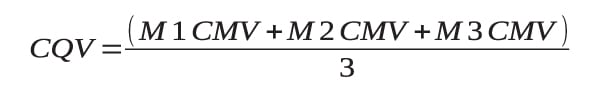
- Category quarterly value (CQV): Category quarterly value or CQV is an important metric that offers a broader perspective on a category’s performance. It denotes the average value of the last three months and is calculated at the end of every quarter. To calculate CQV, you take the CMV values of the category from the past three months (e.g., DAU CMV for the last three months) and calculate their average. This quarterly metric helps smooth out monthly fluctuations and provides a more stable view of how the category is performing over a longer timeframe. For instance, if we’re looking at the CQV for DAU, it would be the average of the DAU values for the past three months, offering a more comprehensive understanding of user engagement trends over a quarter.
- Category change percentage (CCP): This denotes a critical metric used to assess the change in the effectiveness of a specific category over a defined and standardised period. It serves as an indicator of whether the performance of a category is improving or declining. A negative value of the change indicates a downward trend in performance, while a positive value represents an upward trend. This metric plays a pivotal role in tracking and understanding how well a feature is doing in terms of specific categories.
- Category monthly change (CMC): Category monthly change (CMC) is a fundamental metric calculated at the end of every month to determine the percentage change in the performance of a category compared to the previous month. It quantifies how much the effectiveness of the category has either improved or declined within a monthly time frame. CMC is computed by taking the difference between the current CMV and the CMV of the previous month (last CMV), dividing it by the last CMV and multiplying by 100 to express the change as a percentage. This allows for a precise assessment of monthly trends in the category’s performance. For example, if you’re monitoring the DAU category, CMC will help you understand whether the number of active users has increased or decreased compared to the previous month, and by how much.
![]()
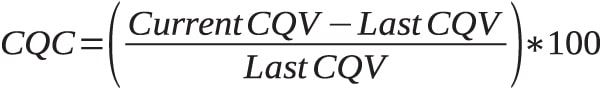
- Category quarterly change (CQC): This denotes a key metric calculated at the end of every quarter, offering insights into the percentage change in the performance of a category compared to the previous quarter. It provides a more comprehensive view of how the effectiveness of the category has evolved over a three-month period. Like CMC, CQC is computed by taking the difference between the current category quarterly value (CQV) and the CQV of the previous quarter (last CQV), dividing it by the last CQV and multiplying by 100 to express the change as a percentage. For instance, if you’re analysing the category of CLV, CQC will help you assess whether the CLV has seen an improvement or decline over the past quarter, and by what percentage.
For now I will conclude the article here. In the next part of this two-part series we will discuss the feature effectiveness indicator (FEI) at length and some examples.


